
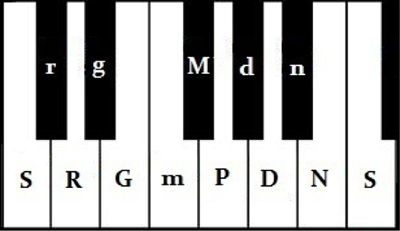
Figure 1
The solfege of Hindustani music shown with an arbitrarily chosen tonic (S) location.
Table 1
Specification of raga grammar for three allied raga-pairs (ITC-SRA, 2017; Rao et al., 1999; AUTRIMNCPA, 2017; Oak, 2017; Kulkarni, 2011; SwarGanga, 2017; Mahajan, 2010). Gaps in Aroha-Avaroha indicate temporal breaks (held svara or pause), under/overline are lower/higher octave markers.
| Feature | Deshkar | Bhupali | Puriya | Marwa | Multani | Todi |
|---|---|---|---|---|---|---|
| Tonal material | SRGPD | SRGPD | SrGMDN | SrGMDN | SrgMPdN | SrgMPdN |
| Aroha Avaroha | SGPD S̅PDS̅ S̅ PDGP DPG(R)S | SRG PDS̅ S̅DP GDP GRS | N(r)G MN(D)S̅ NM DG MG(r)S | DNr GMD Nr̄S̅ r̄ND DMGr DrS | NSgMP PNS̅ SN(d)P gMg (r)NS | SrgMP MdNS̅ SNdP MrgrS |
| Vadi, Samvadi | D, G | G, D | G, N | r, D | S, P | d, g |
| Char. phrases | SGPD, P(D)S̅P DGP, DPG(R)S | RDS, RPG, PDS̅ S̅DP, GDP, GRS | N(r)S, N(r)G, MDG DNM, DG, MG(r)S | DNr, rGMD, Dr̄S̅ r̄ND, DMGr, NDrS | rNS, gMP, PNS̅ NdP, MgM, g(r)S | Srg, PMd, dNS̅ NdP, Md, rgrS |
| Shruti | Higher R, G, D | Natural R, G, D | Lower r | Higher r, D | Higher N | Lower r, g |
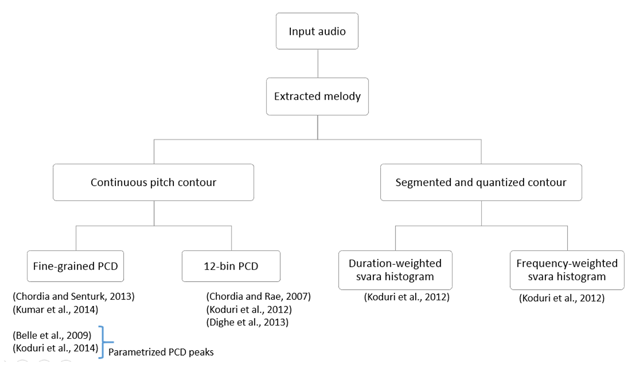
Figure 2
Taxonomy of the previous endeavors in raga recognition from first order pitch distributions.
Table 2
Description of the dataset in terms of number of artists, concerts, and their durations.
| Raga | # Concerts | Duration (hours) | # Artists |
|---|---|---|---|
| Deshkar | 6 | 2:16:50 | 5 |
| Bhupali | 11 | 5:12:23 | 9 |
| Puriya | 7 | 2:30:26 | 7 |
| Marwa | 12 | 4:19:12 | 12 |
| Multani | 7 | 2:30:57 | 7 |
| Todi | 12 | 4:39:55 | 12 |
| # Total | 55 | 21:29:43 | 52 (26 unique) |
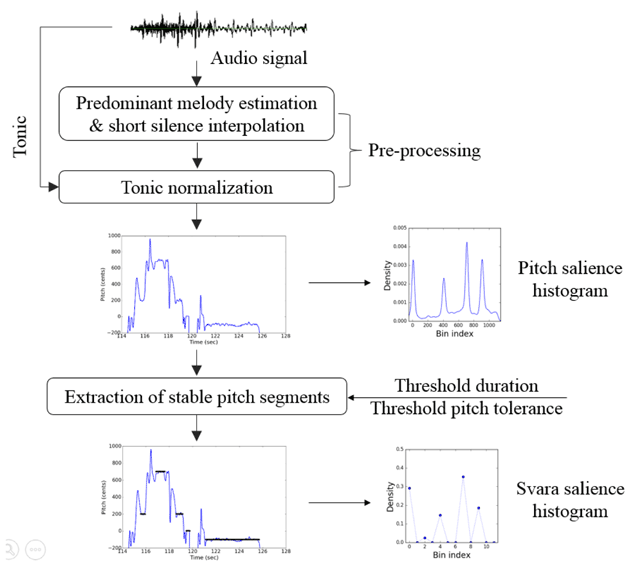
Figure 3
Block diagram of the signal processing chain from audio signal to pitch distributions.
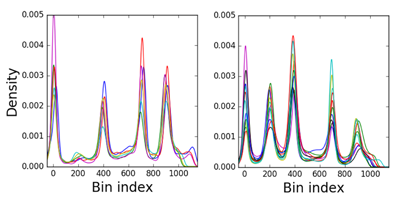
Figure 4
Pitch salience histograms (octave folded, 1 cent bin resolution) of 6 concerts in raga Deshkar (left) and and 11 concerts in raga Bhupali (right).
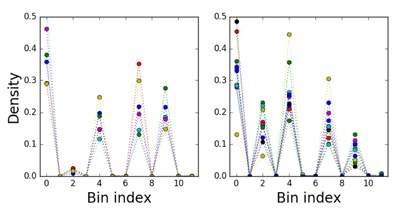
Figure 5
Svara salience histograms (octave folded) of 6 concerts in raga Deshkar (left) and and 11 concerts in raga Bhupali (right).
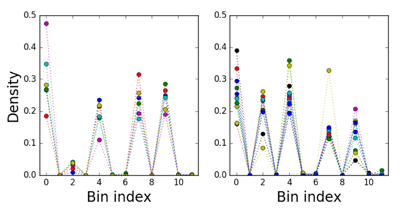
Figure 6
Svara count histograms (octave folded) of 6 concerts in raga Deshkar (left) and 11 concerts in raga Bhupali (right).
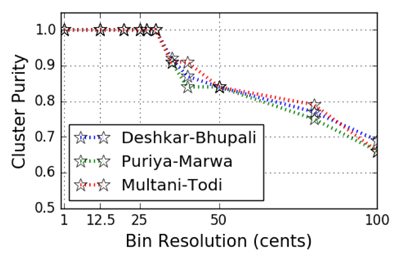
Figure 7
Cluster purity (CP) values obtained for different values of bin resolution for the pitch salience histograms in each of the 3 raga-pairs.
Table 3
Summary of results: evaluation measures AUC and EER for all combinations of representations and distance measures for each of the three allied raga-pairs. In bold font is the highest AUC across distance measures for a given representation and raga-pair.
| Allied raga-pair | Distance measure | Evaluation metric | Pitch salience | Svara salience | Svara count | |||
|---|---|---|---|---|---|---|---|---|
| p = 96 | p = 48 | p = 24 | p = 12 | |||||
| Deshkar-Bhupali | Correlation | AUC | .98 | .97 | .95 | .89 | .85 | .90 |
| EER | .04 | .06 | .08 | .19 | .19 | .15 | ||
| Euclidean | AUC | .97 | .95 | .92 | .86 | .84 | .88 | |
| EER | .08 | .09 | .15 | .20 | .18 | .18 | ||
| City-block | AUC | .98 | .98 | .94 | .90 | .85 | .88 | |
| EER | .05 | .05 | .11 | .18 | .20 | .18 | ||
| Bhattacharyya | AUC | .98 | .98 | .96 | .81 | .93 | .95 | |
| EER | .03 | .05 | .10 | .25 | .09 | .10 | ||
| Puriya-Marwa | Correlation | AUC | .99 | .95 | .90 | .84 | .93 | .94 |
| EER | .02 | .08 | .18 | .23 | .15 | .13 | ||
| Euclidean | AUC | .92 | .90 | .82 | .80 | .94 | .95 | |
| EER | .13 | .17 | .19 | .28 | .15 | .13 | ||
| City-block | AUC | .94 | .93 | .82 | .77 | .95 | .95 | |
| EER | .09 | .12 | .21 | .29 | .13 | .11 | ||
| Bhattacharyya | AUC | .95 | .87 | .79 | .72 | .98 | .94 | |
| EER | .07 | .19 | .23 | .42 | .03 | .11 | ||
| Multani-Todi | Correlation | AUC | .98 | .98 | .93 | .94 | .97 | .99 |
| EER | .04 | .05 | .12 | .15 | .06 | .02 | ||
| Euclidean | AUC | .95 | .96 | .87 | .89 | .93 | .97 | |
| EER | .10 | .08 | .18 | .16 | .12 | .06 | ||
| City-block | AUC | .96 | .97 | .92 | .92 | .96 | .98 | |
| EER | .08 | .05 | .12 | .11 | .08 | .05 | ||
| Bhattacharyya | AUC | .90 | .93 | .90 | .89 | .99 | .98 | |
| EER | .17 | .17 | .11 | .16 | .03 | .03 | ||
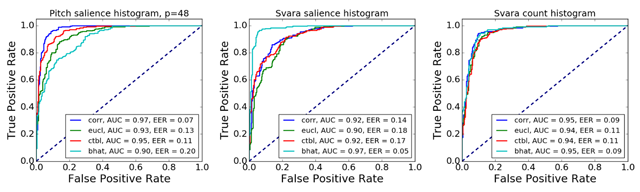
Figure 8
Combination of all three raga-pairs (full concerts): ROCs obtained for four different distance measures from pitch salience (left), svara salience (middle), and svara count (right) histograms from the combined distance vectors for all three raga-pairs.
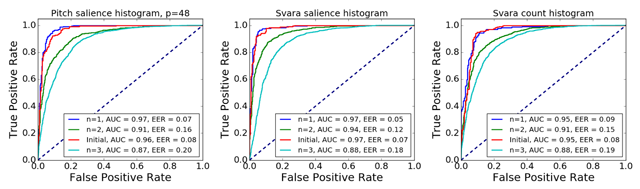
Figure 9
Combination of all three raga-pairs (partial and initial concert segments): Comparison of ROCs obtained with best distance measures (Correlation distance for pitch salience and Bhattacharyya distance for svara histograms) at different time-scales (n = 1, 2, 3) and with the initial portion (alap + vistar).

Figure 10
Svara salience histograms across tala cycles for DK AC-1 (left), DK AC-2 (middle), and DK KA (right).
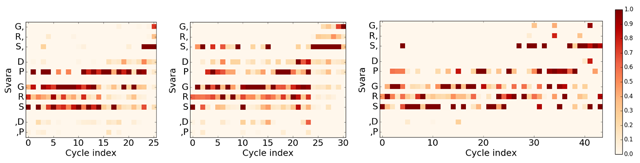
Figure 11
Svara salience histograms across tala cycles for BP AC-1 (left), BP AC-2 (middle), and BP RK (right).
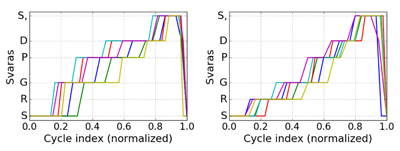
Figure 12
Time-normalized and smoothed cycle-level salient svara curves over the chosen 6 concerts in raga Deshkar (left) and raga Bhupali (right).