
Table 1
Religious Identification, Membership/Attendance and Belief U.S. Adult Population, 2001 and 2008 (weighted). Sources: American Religious Identification Survey, 2001 n = 17,911; American Religious Identification Survey, 2008 n = 1,015
| Identification | Membership/Attendance | Belief in God | Share of Population 2001 | Share of Population 2008 |
|---|---|---|---|---|
| No | No | No | 2.8% | 6.0%** |
| No | No | Yes | 8.2% | 9.5%** |
| Yes | No | No | 1.0% | 4.1%** |
| No | Yes | No | 0.5% | <1% |
| Yes | Yes | No | 0.7% | 1.1%* |
| No | Yes | Yes | 2.2% | <1%** |
| Yes | No | Yes | 30.0% | 24.7%** |
| Yes | Yes | Yes | 54.5% | 53%** |
[i] ** < .01; * < .05
Legend (excluding ‘don’t know’ and ‘refuse’ in both surveys)
2001
Identification: Yes = Identifies with a religion; No = ‘None,’ ‘Atheist,’ ‘Agnostic’ ‘Secular,’ ‘Humanist’
Membership: Yes/No Is anyone in your HH currently a member of a church, temple, or mosque?
Belief that God Exists: Yes = Agree strongly/Agree somewhat; No = Disagree somewhat/Disagree strongly
2008
Identification: Yes = Identifies with a religion; No = ‘None,’ ‘Atheist,’ ‘Agnostic’ ‘Secular,’ ‘Humanist’
Attendance: Yes = Attend more than once a week/Once a week/Once or twice a month; No = A few times a year/Never
Belief in God: Yes = There is definitely a personal God/There is a higher power but no personal God; No = There is no such thing/There is no way to know/I am not sure
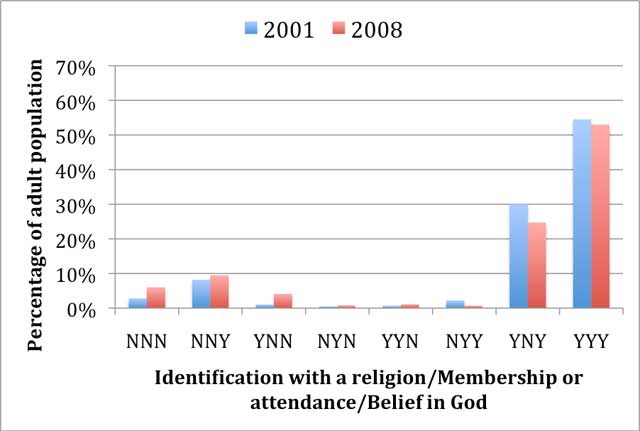
Figure 1
Changes in Belonging, Behavior, and Belief. Source: ARIS 2001 and ARIS 2008
Legend: See Table 1

Figure 2
‘Corroboration from GSS: Changes in Identification, Attendance, and Belief. Source: GSS
Legend
Identification: Yes = all religions; No = no religion
Behavior: How Often Attend Religious Services?
Yes = Attend several times a year/once a month/2–3 times a month/nearly every week/every week or more; No = Never attend religious services/less than once a year/once a year
Belief: Respondent’ Confidence in the Existence of God?
Yes = Some higher power/believe sometimes/believe but doubts/know God exists; No = Do not believe/no way to find out

Figure 3
Religious Identification, Membership and Belief Scale by Gender in 2001. Source: ARIS 2001

Figure 4
Attitudes toward Human Evolution and the Belonging, Behavior, and Belief Scale 2008. Acceptance of Evolution by Religiosity: Most and Least Accepting. Source: ARIS 2008

Figure 5
Probability of Accepting or Rejecting Evolution: The Most Religious versus the Least Religious 2008. Source: ARIS 2008
Table 2
Hierarchical Regression (OLS) of Belonging, Behaving, and Believing 9-Point Scale 2008
| Dependent Variable | BBB Scale | 1 = no, no, no… | 8 = yes, yes, yes | 9 = yes, yes* yes* |
|---|---|---|---|---|
| Predictors | Model 1 | Model 2 | Model 3 | Model 4 |
| Demographic | ||||
| Gender | -.137*** | -.138*** | -.073* | -.052 |
| Age | .103** | .103** | .082** | .041 |
| Geography | ||||
| Region | -.135*** | -.093** | -.063* | |
| Life Cycle Religious Behavior | ||||
| Initiation | -.115*** | -.129*** | ||
| Religious Funeral | -.465*** | -.364*** | ||
| Religious Attitudes | ||||
| Human Evolution | -.340*** | |||
| Adjusted R2 | .031 | .048 | .291 | .385 |
[i] *** < .001; ** < .01; * < .05
Note: Standardized regression coefficients are shown. The baseline are adult females, living in the South, who had a religious initiation, such as baptism, who expect to have religious funeral services, and do not believe in human evolution. Age is a continuous variable.