
Table 1
Definitions of Sexual and Gender Identities for Survey Participants.
| Biological Sex: | |
| male | an individual who has been assigned – typically based on genitalia – to the sex category that is generally responsible for producing sperm; most human males have penises and testes |
| female | an individual who has been assigned – typically based on genitalia – to the sex category that is generally responsible for producing ova (i.e., eggs); most human females have a vagina, ovaries, and a uterus |
| intersex | individuals whose sex assignment is ambiguous, typically based on genitalia that are ambiguous (i.e., their genitalia do not clearly reflect genitalia that are usually assigned to male or female categories) |
| Gender: | |
| gender | the range of characteristics relating to and differentiating between masculinity and femininity |
| masculinity | the set of qualities or characteristics that are considered appropriate for boys or men |
| femininity | the set of qualities or characteristics that are considered appropriate for girls or women |
| Sexual Orientations: | |
| heterosexual | a characteristic of someone who is attracted primarily or exclusively to an individual of a different biological sex or gender (e.g., a male attracted to a female) |
| homosexual | a characteristic of someone attracted primarily or exclusively to an individual of a same biological sex or gender (e.g., a female attracted to a female) |
| bisexual | a characteristic of someone attracted to individuals of different and same biological sexes or genders (e.g., a female attracted to both males and females) |
| Gender Identities: | |
| transgender | a characteristic of someone whose gender identity does not match their assigned biological sex (e.g., someone who was assigned to be male at birth but who feels feminine) |
| cisgender | a characteristic of someone whose gender identity does match their assigned biological sex (e.g., someone who was assigned to be female at birth and feels feminine) |
| transman | an individual whose biological sex was assigned as female but who feels and identifies as male |
| transwoman | an individual whose biological sex was assigned as male but who feels and identifies as female |
| cisman | an individual whose biological sex was assigned as male who feels and identifies as male |
| ciswoman | an individual whose biological sex was assigned as female who feels and identifies as female |
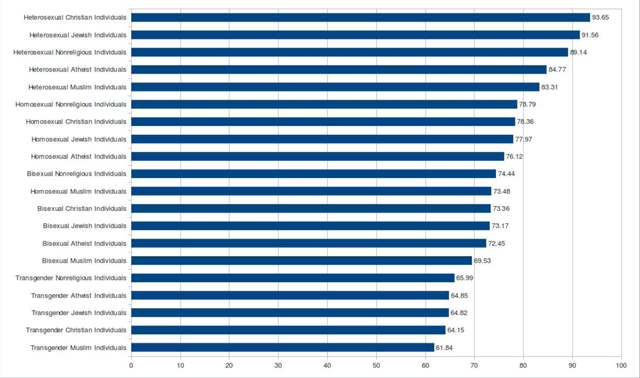
Figure 1
Intersectional identity mean thermometer scores, ranked (all participants).
Table 2
Demographic characteristics of survey participants.
| N = 618 % (mean; sd) | |
|---|---|
| age | (39.31; 16.015) |
| US region or international* | |
| South | 29.2 |
| Northeast | 43.8 |
| Midwest | 6.8 |
| Pacific and Mountain | 5.3 |
| US territories | 6.2 |
| international | 8.8 |
| marital/relationship status | |
| single, never married | 32.8 |
| married | 38.7 |
| divorced | 10.2 |
| widowed | 1.1 |
| separated | 1.1 |
| dating exclusively | 8.7 |
| cohabiting | 6.5 |
| other | 0.8 |
| race/ethnicity | |
| White, non-Hispanic | 68.0 |
| Black, non-Hispanic | 6.0 |
| Hispanic White | 14.2 |
| Hispanic Black | 0.8 |
| Asian | 1.5 |
| Other | 3.6 |
| missing | 6.0 |
| education | |
| less than high school | 0.8 |
| high school diploma | 11.1 |
| some college | 21.0 |
| Associate’s degree | 10.1 |
| Bachelor’s degree | 34.1 |
| Master’s degree | 14.7 |
| PhD | 1.0 |
| professional degree (MD/JD) | 7.2 |
| income | |
| under $10,000 | 4.2 |
| $10,000–$24,999 | 6.5 |
| $25,000–$49,999 | 15.5 |
| $50,000–$74,999 | 18.3 |
| $75,000–$99,999 | 17.5 |
| $100,000–$199,999 | 21.8 |
| $200,000–$499,999 | 12.1 |
| over $500,000 | 4.0 |
| political views | |
| very conservative | 2.6 |
| conservative | 16.9 |
| moderate, but lean conservative | 11.8 |
| moderate | 29.6 |
| moderate, but lean liberal | 12.1 |
| liberal | 21.7 |
| very liberal | 5.3 |
[i] *We did not have survey respondents from every state, but did have respondents from 38 states and 2 US territories. The regions shown in this table included respondents from each of the following states: South = Alabama, Florida, Georgia, Kentucky, Louisiana, North Carolina, South Carolina, Tennessee, Texas; Northeast = Connecticut, Delaware, Maine, Maryland, Massachusetts, New Hampshire, New Jersey, New York, Pennsylvania, Rhode Island, Vermont, Virginia, West Virginia, District of Columbia; Midwest = Illinois, Kansas, Michigan, Minnesota, Missouri, Nebraska, Ohio, Wisconsin; Pacific and Mountain = California, Colorado, Idaho, New Mexico, Oregon, Utah, and Washington; Territories = Puerto Rico and Virgin Islands.
Table 3
Sex, gender, sexual orientation, and religiosity characteristics of survey participants.
| N = 618 | |
|---|---|
| biological sex | |
| male | 36.7 |
| female | 62.8 |
| intersex | 0.3 |
| other | 0.2 |
| gender | |
| cisgender | 99.0 |
| transgender | 0.2 |
| other | 0.8 |
| sexual identity/orientation | |
| heterosexual | 92.0 |
| homosexual | 3.9 |
| bisexual | 3.1 |
| other | 1.0 |
| religious affiliation | |
| Catholic | 35.6 |
| nonreligious (includes atheists and agnostics) | 22.3 |
| Southern Baptist | 3.1 |
| Non-denominational Christian | 14.5 |
| Jewish | 6.9 |
| Methodist | 3.3 |
| Presbyterian | 2.4 |
| Lutheran | 2.9 |
| Muslim | 1.1 |
| Hindu | 0.3 |
| Buddhist | 0.5 |
| Protestant (otherwise unspecified) | 2.8 |
| other | 4.2 |
| view of god/higher power | |
| I do not believe there is a god | 8.9 |
| I do not know if there is a god and I do not believe there is a way to find out if there is a god | 10.5 |
| I believe in some form of higher power | 16.7 |
| I believe in god sometimes | 4 |
| I believe in god, but I doubt my belief sometimes | 12.9 |
| I am confident god exists | 44.8 |
| other/choose not to respond | 2.1 |
| view of Bible | |
| The Bible is the actual word of God and is to be taken literally, word for word. | 12.7 |
| The Bible is the inspired word of God but not everything in it should be taken literally, word for word. | 51.9 |
| The Bible is an ancient book of fables, legends, history, and moral precepts recorded by men. | 26.6 |
| other | 1.6 |
| The Bible is not part of my religion. | 7.2 |
| religious service attendance | |
| never | 16.9 |
| less than once a year | 13.8 |
| about once or twice a year | 15.3 |
| several times a year | 13.7 |
| about once a month | 7.7 |
| 2–3 times a month | 7.2 |
| nearly every week | 7.9 |
| every week | 14.3 |
| several times a week | 3.1 |

Figure 2
Intersectional identity mean thermometer scores, ranked (only religious participants; n = 476).
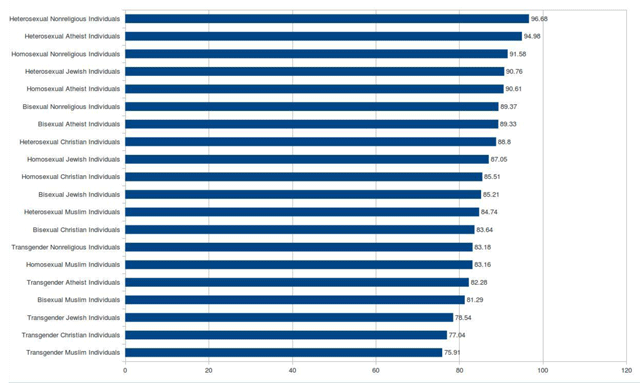
Figure 3
Intersectional identity mean thermometer scores, ranked (only nonreligious participants; n = 137).
Table 4
Exploratory Factor Analysis of Thermometer Scores Toward Intersecting Sexuality, Gender, and Religion Identities: All Participants.
| 1 | 2 | 3 | |
|---|---|---|---|
| Heterosexual Christian Individuals | –0.005 | 0.026 | 0.856 |
| Heterosexual Jewish Individuals | 0.094 | 0.276 | 0.820 |
| Heterosexual Nonreligious Individuals | 0.192 | 0.759 | 0.330 |
| Heterosexual Atheist Individuals | 0.247 | 0.787 | 0.288 |
| Heterosexual Muslim Individuals | 0.332 | 0.252 | 0.680 |
| Homosexual Atheist Individuals | 0.589 | 0.741 | 0.070 |
| Homosexual Nonreligious Individuals | 0.598 | 0.736 | 0.069 |
| Homosexual Christian Individuals | 0.608 | 0.574 | 0.261 |
| Homosexual Jewish Individuals | 0.627 | 0.619 | 0.192 |
| Homosexual Muslim Individuals | 0.671 | 0.531 | 0.274 |
| Bisexual Nonreligious Individuals | 0.736 | 0.576 | 0.042 |
| Bisexual Atheist Individuals | 0.744 | 0.567 | 0.040 |
| Bisexual Christian Individuals | 0.756 | 0.441 | 0.200 |
| Bisexual Jewish Individuals | 0.769 | 0.479 | 0.156 |
| Bisexual Muslim Individuals | 0.796 | 0.386 | 0.220 |
| Transgender Atheist Individuals | 0.888 | 0.308 | 0.034 |
| Transgender Nonreligious Individuals | 0.890 | 0.315 | 0.017 |
| Transgender Muslim Individuals | 0.922 | 0.203 | 0.195 |
| Transgender Christian Individuals | 0.927 | 0.186 | 0.179 |
| Transgender Jewish Individuals | 0.927 | 0.224 | 0.120 |
| Initial Eigenvalues | 13.507 | 2.001 | 1.086 |
| Variance Explained | 67.536 | 10.005 | 5.429 |
[i] Note: Boxes highlighted in gray are the variables that load on the corresponding factors.