
Table 1
Descriptive statistics, subsample of nonbelieving respondents (do not believe in God or a higher power), unweighted.
| N | Mean | SD | Min. | Max. | |
|---|---|---|---|---|---|
| Frequency of taking part in meetings or activities with atheist, humanist or secularist organizations in past 12 months | 972 | 1.286 | .941 | 1 | 6 |
| Frequency of posting on social media about atheist, humanist, secularist or nonbelief values, views or practices in past 12 months | 975 | 1.587 | 1.266 | 1 | 6 |
| Frequency of reading or watching online content on atheist, humanist, secularist or nonbelief values, ideas or practices in past 12 months | 977 | 1.981 | 1.339 | 1 | 6 |
| Age | 982 | 25.895 | 5.283 | 18 | 35 |
| Female | 982 | .496 | .500 | 0 | 1 |
| Male | 982 | .487 | .500 | 0 | 1 |
| Another gender | 982 | .017 | .130 | 0 | 1 |
| Canadian resident | 982 | .675 | .469 | 0 | 1 |
| High school education or less | 982 | .439 | .497 | 0 | 1 |
| Post-secondary education below university | 982 | .301 | .459 | 0 | 1 |
| University degree | 982 | .260 | .439 | 0 | 1 |
| Reside in area with pop. < 50,000 | 981 | .268 | .443 | 0 | 1 |
| Foreign born | 978 | .078 | .268 | 0 | 1 |
| 2nd generation immigration | 978 | .178 | .383 | 0 | 1 |
| 3rd or older generation immigration | 978 | .744 | .436 | 0 | 1 |
| Non-white ethno-racial background | 981 | .265 | .442 | 0 | 1 |
| Religiously affiliated mother during childhood | 982 | .615 | .487 | 0 | 1 |
| Religiously affiliated father during childhood | 982 | .547 | .498 | 0 | 1 |
| Mixed parental (non)religious background | 982 | .227 | .419 | 0 | 1 |
| Frequency of religious education as a child | 982 | 2.708 | 1.341 | 1 | 5 |
| Belief in mysterious and connected universe and natural world | 982 | .341 | .474 | 0 | 1 |
| Belief that life on Earth is purely the result of complex biological, physical and material processes | 982 | .327 | .469 | 0 | 1 |
| Unsure about beliefs | 982 | .204 | .403 | 0 | 1 |
| Indifferent about beliefs | 982 | .128 | .335 | 0 | 1 |
| Frequency of experienced (non)religious discrimination in past 12 months | 975 | 1.318 | .732 | 1 | 5 |

Figure 1
In past 12 months, frequency of taking part in the following atheist, humanist, or secularist activities, among Canadian and USA respondents 18–35 years old, 2019.
Notes: Millennial Trends Survey 2019. Percentages weighted to be representative of Canadian and USA young adult populations.
Table 2
Correlation matrix for frequency of organized and digital nonbelief activities, among nonbelieving respondents 18–35 years old.
| Organized nonbelief | Social media poster | Digital consumer | |
|---|---|---|---|
| Organized nonbelief | 1 | ||
| Social media poster | .440*** | 1 | |
| Digital consumer | .333*** | .428*** | 1 |
[i] Notes: Spearman correlation coefficients. † = p ≤ .10; * = p ≤ .05; ** = p ≤ .01; *** = p ≤ .001.

Figure 2
Types of atheist, humanist and secularist involvement among respondents 18–35 years old who do not believe in God or a higher power, 2019.
Notes: Millennial Trends Survey 2019. N = 982.
Table 3
Effects (in odds ratios) on frequency of taking part in organized and digital nonbelief activities in past 12 months, respondents 18–35 years old who do not believe in God or a higher power, 2019.
| 1) Meetings or activities with organizations | 2) Posting on social media | 3) Consuming digital content | |
|---|---|---|---|
| N = 967 LL = –403.449 McFadden’s R2 = .087 | N = 970 LL = –750.835 McFadden’s R2 = .020 | N = 972 LL = –1015.503 McFadden’s R2 = .040 | |
| Exp(b) | Exp(b) | Exp(b) | |
| Age | .965 | .981 | .964** |
| Male | 1.679* | 1.129 | 1.016 |
| Canada | .220*** | .507*** | .815 |
| Post-secondary below uni. (ref. high school or less) | .845 | .957 | .765 |
| University degree (ref. high school or less) | 1.073 | .888 | 1.069 |
| Reside in area with pop. < 50,000 | .776 | 1.007 | .769† |
| Foreign born (ref. 3rd gen. or older imm.) | 1.470 | 1.098 | 1.185 |
| 2nd gen. immigration (ref. 3rd gen. or older imm.) | .663 | 1.014 | 1.284 |
| Religiously affiliated mother during childhood | .703 | .816 | .818 |
| Religiously affiliated father during childhood | 1.709† | 1.508† | 1.407* |
| Mixed parental (non)religious background | 1.314 | .997 | 1.237 |
| Level of religious socialization (five categories) | 1.352*** | 1.135† | 1.180** |
| Belief in mysterious and connected universe and natural world (ref. material worldview) | 1.724* | .891 | .921 |
| Unsure about beliefs (ref. material worldview) | 1.085 | .617* | .651* |
| Indifferent about beliefs (ref. material worldview) | 1.153 | .798 | .236*** |
| /cut1 | 1.756 | .689 | –.534 |
| /cut2 | 2.479 | 1.472 | 1.022 |
| /cut3 | 3.163 | 2.169 | 1.914 |
| /cut4 | 3.118 | 3.297 |
[i] Notes: Millennial Trends Survey 2019. Ordered logit (ologit) models. † = p ≤ .10; * = p ≤ .05; ** = p ≤ .01; *** = p ≤ .001.

Figure 3
Predicted probabilities of taking part in organized and digital nonbelief activities at least once in past 12 months, with CI 95%, respondents 18–35 years old who do not believe in God or a higher power, 2019.
Notes: Millennial Trends Survey 2019. Ordered logit (ologit) models. See Table 3 for complete results.
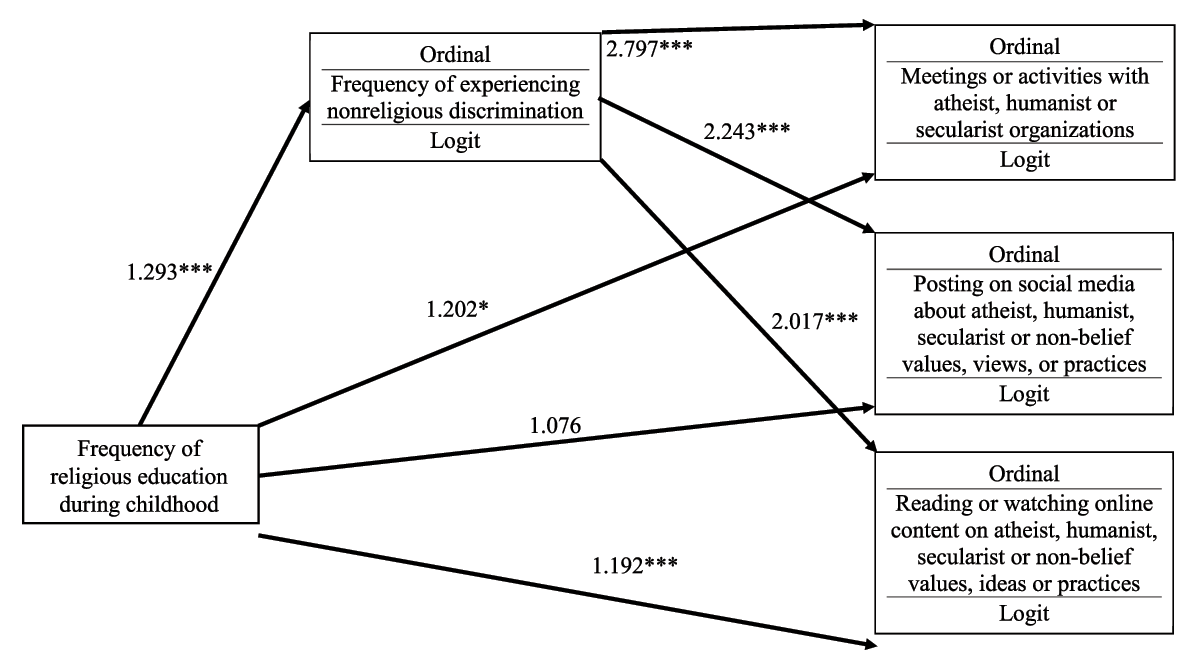
Figure 4
Direct and indirect socialization effects (in odds ratios) on frequency of taking part in atheist, humanist and secularist activities in past 12 months, respondents 18–35 years old who do not believe in God or a higher power, 2019.
Notes: Results from generalized structural equation (path) logit model. Sociodemographic controls include age, gender, level of education, country of residence, generation of immigration, and rural residence (not illustrated here). Maximum likelihood estimation. † = p ≤ .10; * = p ≤ .05; ** = p ≤ .01; *** = p ≤ .001. Log likelihood for baseline model with only sociodemographic covariates = –2,220.860; Log likelihood for full path model = –2,735.974; Likelihood ratio test: p = 0.000. AIC baseline model = 4,511.719; AIC full model = 5,579.949. BIC baseline model = 4,682.676; BIC full model 5,843.323. For complete results, see Table A.4 in the online supplementary materials.