

Figure 1
Conceptual model of synthesis of six theories of religious and secular change.
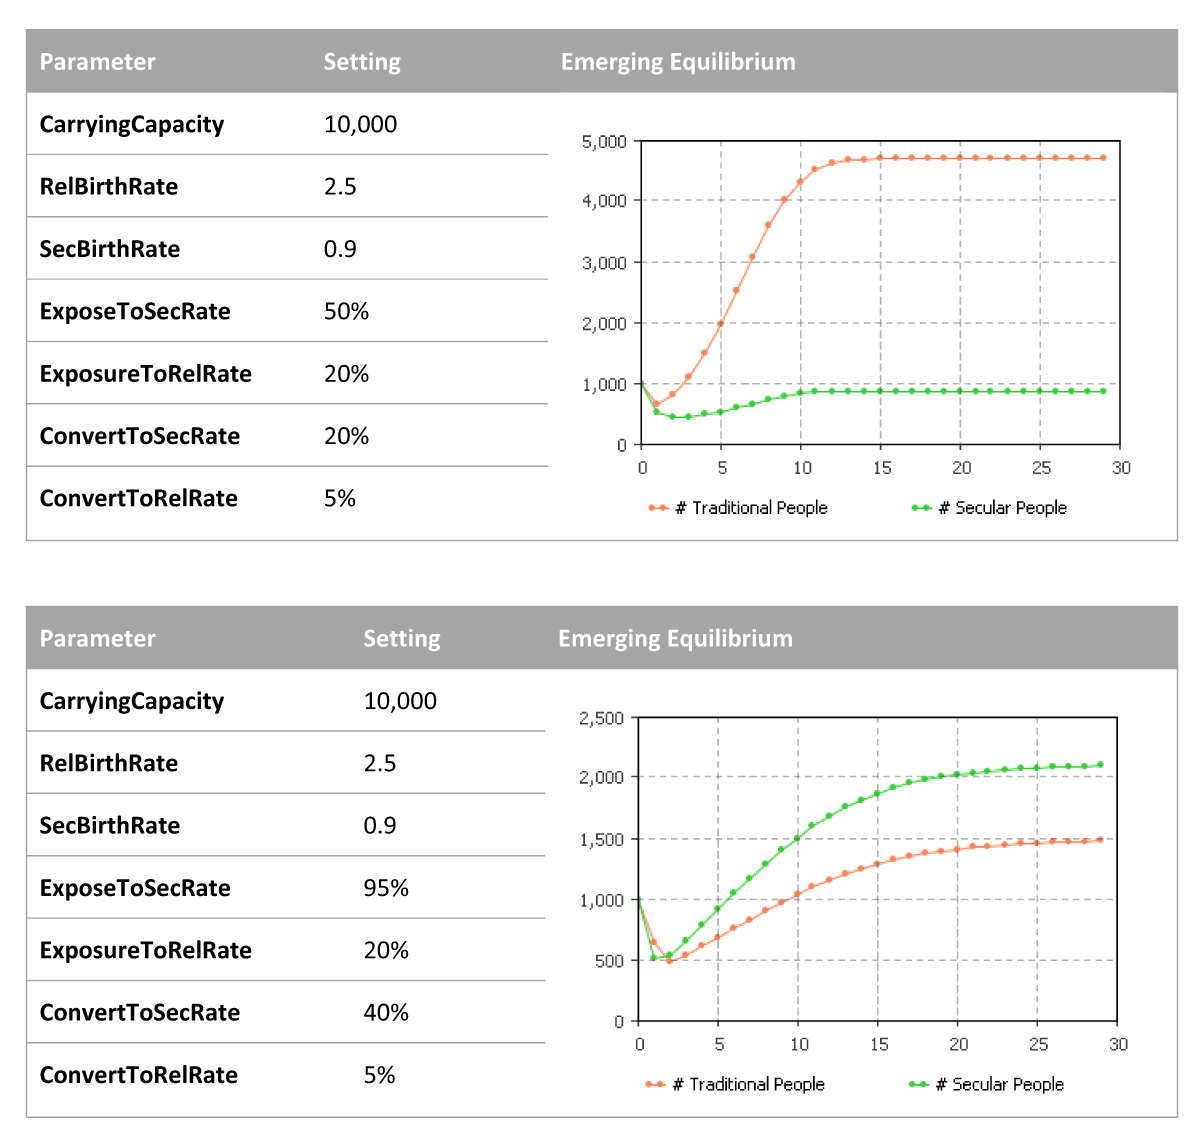
Figure 2
a (top): The conversion process shows an emerging equilibrium between supernatural religious (orange) and post-supernatural secular (green) people. The horizontal axis is model time. The vertical axis is the number of people of each type. The equilibrium depicts a social situation in which a small secular enclave exists within a larger supernatural population. b (bottom): The conversion model’s emerging equilibrium with parameters set to yield more post-supernatural secular people than supernatural religious people. Only two parameters are changed between the two cases: the rate of exposure of supernatural religious people to post-supernatural secular worldviews (ExposeToSecRate) and the rate of conversion of supernatural religious people to post-supernatural secular worldviews (ConvertToSecRate).
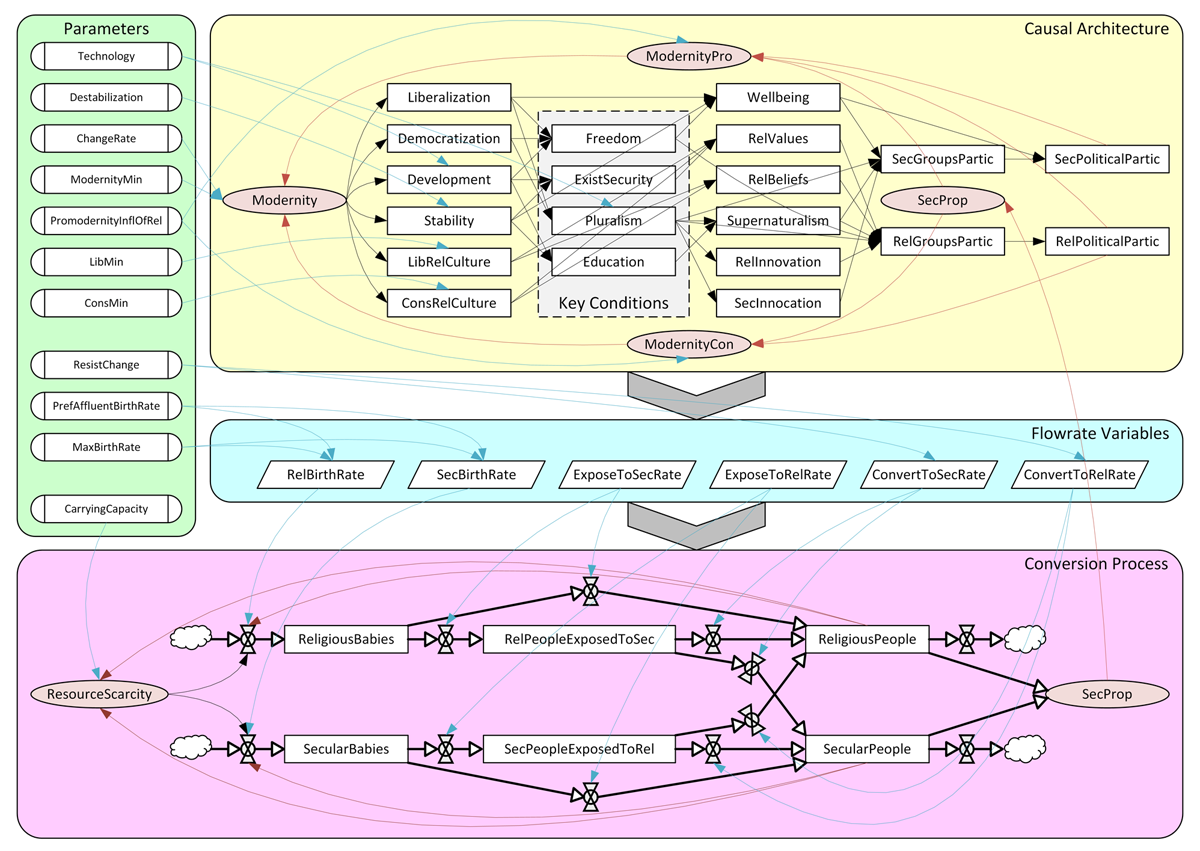
Figure 3
FOREST: The system-dynamics model using the causal architecture from the conceptual model of Figure 1 to derive flowrate variables needed to drive a conversion process back and forth between supernatural religious and post-supernatural secular outlooks. Parameters fixed for a given run of the simulation are arrayed along the left side of the figure. The conversion process is the bottom part of Figure 3. The six flow-rate variables driving the conversion process are in the middle part of Figure 3, fed by the top part and feeding into the bottom part. The four key conditions from the conceptual model (shaded in Figure 1) are lined up together in the middle of the causal architecture in the top part of Figure 3 and enclosed in a shaded box.
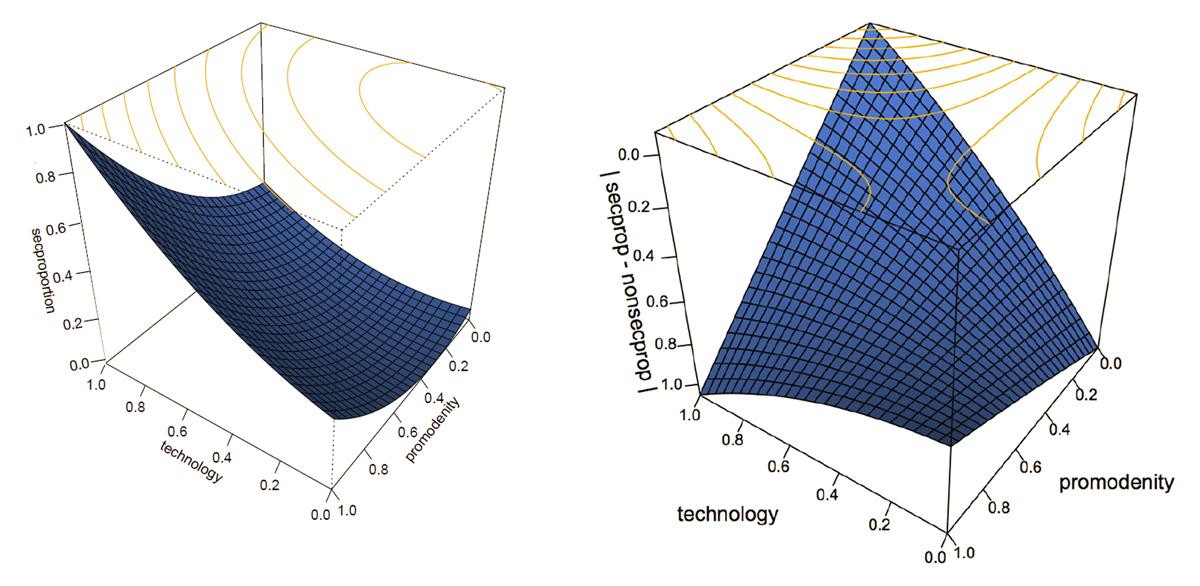
Figure 4
a (left): FOREST response surface for the proportion of the post-supernatural secular population as a function of the level of technology and the pro-modernity influence of supernatural religious worldviews. b (right): FOREST response surface for the difference between the proportion of the post-supernatural secular population and the proportion of the supernatural religious population as a function of the level of technology and the pro-modernity influence of religious worldviews.
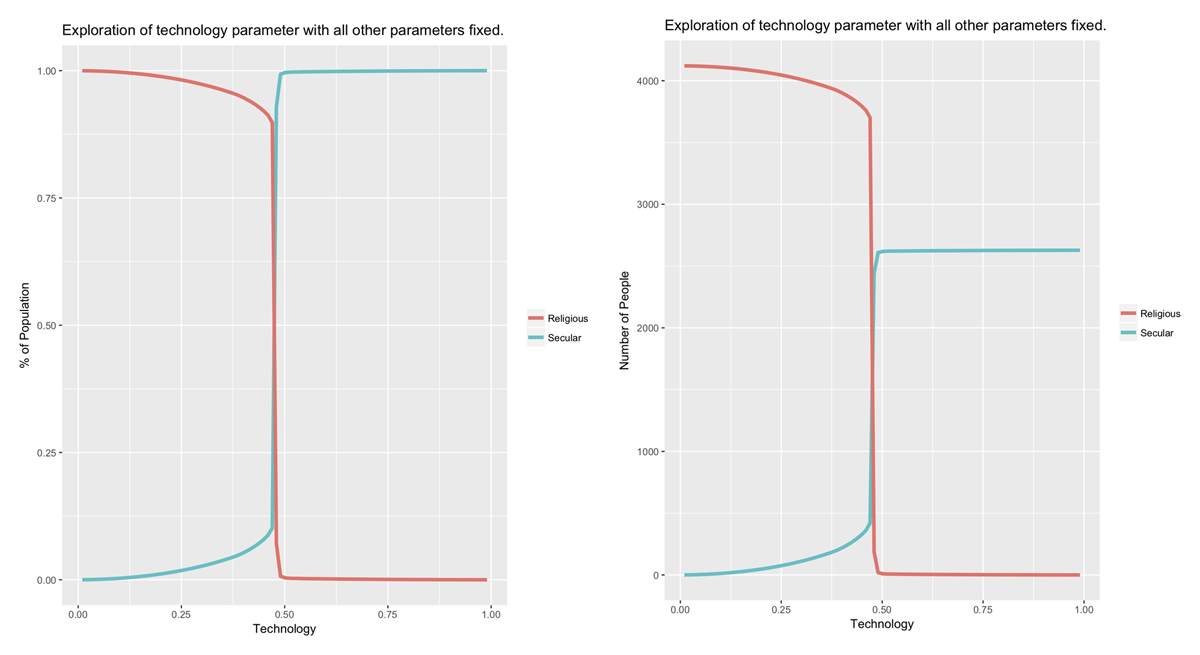
Figure 5
a (left): equilibrium state for the post-supernatural secular (SecProp) and supernatural religious (1–SecProp) populations plotted against the technology parameter, showing sensitive dependence on the technology at the boundary between the two equilibrium regimes. b (right): the same with population numbers instead of percentages, which shows that a dominantly post-supernatural secular population is much smaller overall, with important sustainability and ecological implications.

Figure 6
FOREST scatter plots illustrating the impact of the destabilization parameter (horizontal axis) on the proportion of post-supernatural secular people (vertical axis) for different levels of technology (color intensity) and the promodernity influence of supernatural religion (PM; in the panels).

Figure 7
FOREST simulation results showing the conditions under which various levels of secularism emerge and persist in a population. The vertical axis of each panel is the proportion of secular people, and this same variable distinguishes the panels (the cut-offs for panels are 0.00, 0.25, 0.50, 0.75, 1.00). Freedom is on the horizontal axis, pluralism is color, education is shape, and existential security is size.

Figure 8
FOReST simulation results showing the effect of (1) strengthening key conditions (years 0–400) and (2) a destabilizing event that weakens key conditions (after year 400).
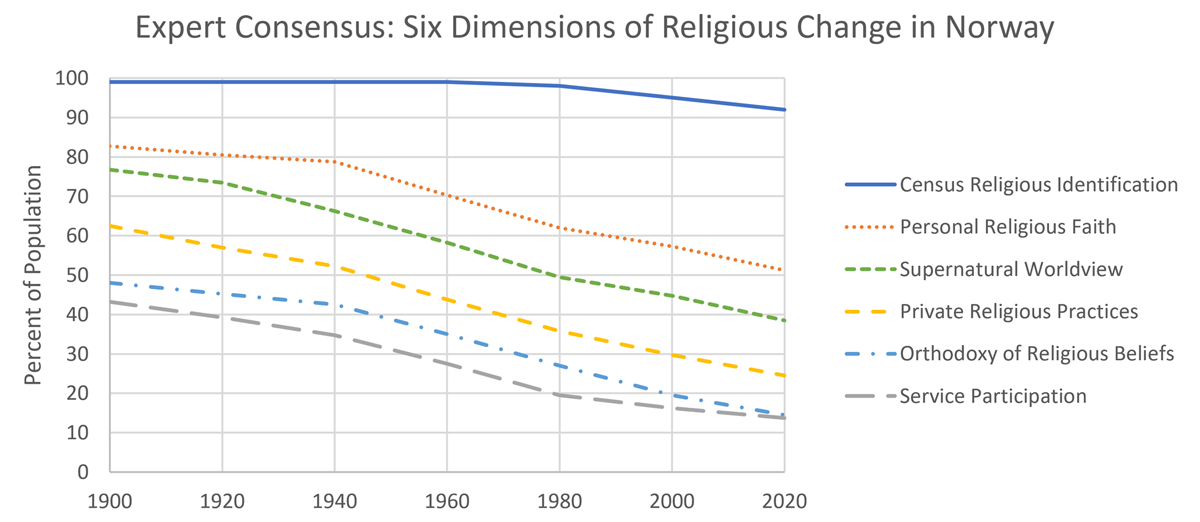
Figure 9
A summary of the consensus of four experts in modern religious history of Norway, estimating the change in six dimensions of religiosity over the last 120 years. Note the S-curve transition with the slope steepest in decades immediately following World War II (ended in 1945). Also note that, for this group of experts, the average of Personal Religious Faith and Private Religious Practices serves as a reasonable proxy for the estimated level of supernatural worldviews.