
Table 1
Rate of Religious Belonging, Behavior, and Belief in the general US population (Keysar, 2014, p. 7).
| Belonging | Behavior | Belief | Rate in the general population (%) |
|---|---|---|---|
| No | No | No | 6.0 |
| No | No | Yes | 9.5 |
| Yes | No | No | 4.1 |
| No | Yes | No | <1 |
| Yes | Yes | No | 1.1 |
| No | Yes | Yes | <1 |
| Yes | No | Yes | 24.7 |
| Yes | Yes | Yes | 53 |
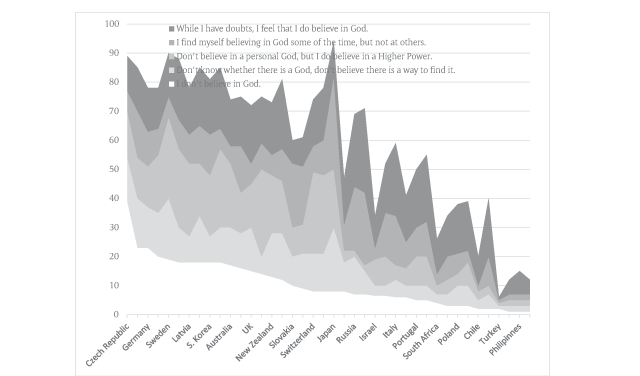
Figure 1
Percentage of the population stating some level of doubt about the existence of God (Keysar & Navarro-Rivera, 2013, p. 578).
Table 2
The Relationship between Islam, Christianity and Non-belief. Correlations between the ratio of people who self-identified themselves as Muslims, Christians, Atheists, and Agnostics within the population of 186 countries in the world.
| Self-identity | Islam | Christianity | ||||
|---|---|---|---|---|---|---|
| World | Atheist | Pearson Correlation | –.249 | ** | –.020 | |
| Sig. (2-tailed) | .001 | .789 | ||||
| N | 186 | 186 | ||||
| Agnostic | Pearson Correlation | –.316 | ** | .053 | ||
| Sig. (2-tailed) | .000 | .470 | ||||
| N | 186 | 186 | ||||
| Countries, more than 50% of their population is Christian or Muslim. | Atheist | Pearson Correlation | –.265 | ** | .119 | |
| Sig. (2-tailed) | .001 | .135 | ||||
| N | 159 | 159 | ||||
| Agnostic | Pearson Correlation | –.335 | ** | .156 | * | |
| Sig. (2-tailed) | .000 | .049 | ||||
| N | 159 | 159 | ||||
[i] * Correlation is significant at the 0.05 level (2-tailed).
** Correlation is significant at the 0.01 level (2-tailed).
Source: ARDA 2014, http://www.thearda.com/internationalData/.
Table 3
The relationship between Islam, Christianity and non-belief.
| Islam | Christianity | |||||
|---|---|---|---|---|---|---|
| World | Non-belief (I don’t believe in God) | Pearson Correlation | –.386 | ** | –.043 | |
| Sig. (2-tailed) | .000 | .680 | ||||
| N | 96 | 95 | ||||
| Europe and Islamic Countries | Pearson Correlation | –.681 | ** | .367 | ** | |
| Sig. (2-tailed) | .000 | .005 | ||||
| N | 58 | 58 | ||||
| All Countries Except Europe | Pearson Correlation | –.298 | * | –.115 | ||
| Sig. (2-tailed) | .017 | .371 | ||||
| N | 64 | 63 | ||||
[i] * Correlation is significant at the 0.05 level (2-tailed).
** Correlation is significant at the 0.01 level (2-tailed).
Source: Eurobarometer, 2005; Zuckerman, 2007; Keysar & Navarro-Rivera, 2013; ISSP, 2008; national statistics agencies.
Table 4
Religious conversion and deconversion rates in 40 countries (Barro et al, 2010, p. 23).
| Total Former | N | Current identification | ||||||||
|---|---|---|---|---|---|---|---|---|---|---|
| Catholic | Protestant | Muslim | Hindu | Eastern | Jewish | Orthodox | Other | None | ||
| Catholic | 9,557 | 8,131 | 41 | 2 | 1 | 0 | 1 | 20 | 69 | 1,292 |
| Protestant | 3,264 | 32 | 2,585 | 0 | 0 | 1 | 0 | 5 | 43 | 598 |
| Muslim | 188 | 1 | 0 | 180 | 0 | 0 | 0 | 0 | 0 | 7 |
| Hindu | 6 | 0 | 1 | 0 | 4 | 0 | 0 | 0 | 0 | 1 |
| Eastern | 8 | 1 | 0 | 0 | 0 | 6 | 0 | 1 | 0 | 0 |
| Jewish | 29 | 0 | 0 | 0 | 0 | 0 | 23 | 3 | 0 | 3 |
| Orthodox | 3,586 | 13 | 10 | 1 | 0 | 0 | 1 | 3,480 | 15 | 66 |
| Other | 523 | 28 | 47 | 0 | 0 | 0 | 1 | 5 | 367 | 75 |
| None | 6,927 | 986 | 314 | 22 | 1 | 1 | 3 | 422 | 50 | 5,128 |
| Total Current | 24,088 | 9,192 | 2,998 | 205 | 6 | 8 | 29 | 3,936 | 544 | 7,170 |
Table 5
Rates of deconversion to non-belief in Christianity and Islam.
| Religion, raised in | Current non-belief in God | |
|---|---|---|
| Non-believer (atheist & agnostic) | Not believe but used to | |
| Christian | 58.34% | 84.66% |
| Muslim | 0.69% | 0.41% |
| No Religion | 32.75% | 10.03% |
| Other | 8.22% | 4.10% |
| Total | 100% | 100% |
[i] Source: ISSP 2008.
Table 6
Comparing those who were raised in Islam from Islamic countries and from other countries.
| % Believing in God | ||||
|---|---|---|---|---|
| Atheist | Agnostic | Believer | ||
| Raised in Islam | In Islamic countries | 1.67% | 0.84% | 95.95% |
| In other countries | 3.14% | 3.80% | 84.82% | |
[i] Source: ISSP 2008.
Table 7
Comparing those who were raised in Catholicism from Catholic countries and from other countries.
| % Believing in God | ||||
|---|---|---|---|---|
| Atheist | Agnostic | Believer | ||
| Raised in Catholicism | In Catholic country | 4.96 | 6.75 | 78.76 |
| In other country | 15.19 | 14.63 | 54.61 | |
[i] Source: ISSP 2008.
Table 8
The relationship between non-belief and going to church.
| Church attendance | |||
|---|---|---|---|
| Non-belief | Pearson Correlation | –.700 | ** |
| Sig. (2-tailed) | .002 | ||
| N | 17 | ||
[i] ** Correlation is significant at the 0.01 level (2-tailed).
Table 9
The relationship between non-belief and going to mosque.
| Mosque attendance once a week | ||
|---|---|---|
| Non-belief | Pearson Correlation | –.256 |
| Sig. (2-tailed) | .239 | |
| N | 23 | |
[i] Source: Pew, 2012; ARDA, 2014.