
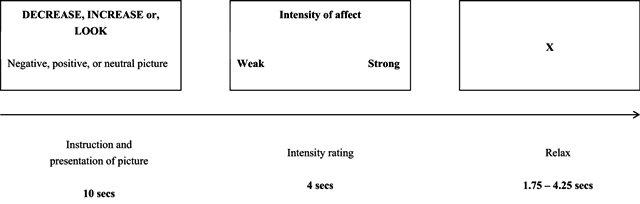
Figure 1
Design of the experimental trials. Timeline for events on each trial. An initial cue instructs participants to decrease, increase, or look. Below this instruction, the picture was presented. During the presentation of the picture, participants follow the instruction. Participants then provide a rating of their current affect and finally have a moment to relax before the onset of the next trial.
Table 1
Means, standard deviations and significance of differences on emotional intelligence between EC and improvisation group prior and after interventions.
| EC group | Improvisation group | ||
|---|---|---|---|
| Prior intervention | 145.86 (20.23) | 146.78 (16.79) | t(34) = -0.15, p = .879 |
| After intervention | 154.83 (23.25) | 140.28 (0.05) | t(34) = 2.01, p = .05 |
Table 2
Means and standard deviations on-line ratings of emotional arousal during each condition and for each group before emotional competencies training.
| EC group | Improvisation group | ||
|---|---|---|---|
| Conditions | |||
| Decrease negative | 2.00 (0.13) | 1.93 (0.13) | F(1, 34) = 0.18, p = .68 |
| Increase positive | 3.20 (0.09) | 3.19 (0.09) | F(1, 34) = 0.02, p = .89 |
| Watch negative | 2.56 (0.12) | 2.53 (0.12) | F(1, 34) = 0.61, p = .44 |
| Watch positive | 2.52 (0.11) | 2.39 (0.11) | F(1, 34) = 0.03, p = .87 |
Table 3
Means and standard deviations on-line ratings of emotional arousal during each condition and for each group after emotional competencies training.
| EC group | Improvisation group | ||
|---|---|---|---|
| Conditions | |||
| Decrease negative | 1.71 (0.12) | 2.06 (0.12) | F(1, 34) = 4.07, p = .05 |
| Increase positive | 3.38 (0.09) | 3.01 (0.09) | F(1, 34) = 8.64, p < .01 |
| Watch negative | 2.71 (0.11) | 2.55 (0.11) | F(1, 34) = 1.11, p = .30 |
| Watch positive | 2.47 (0.12) | 2.22 (0.12) | F(1, 34) = 2.18, p = .15 |
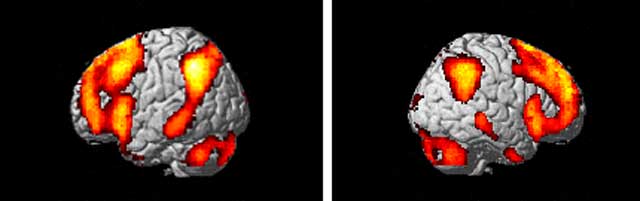
Figure 2
Activated brain regions for the contrast of decrease > watch for the negative pictures independently of the group before the EC training (first scanning). Two panels show left and right lateral views of regions active in the decrease negative – look negative contrast.
Table 4
Brain regions associated with the down-regulation of negative pictures in both groups during the first scanning session before the EC training (p < .05, corrected for whole brain volume, if not otherwise specified). Note that the contrasts reflect activity relative to the watch negative condition. All coordinates refer to MNI voxel space.
| Conjuction | ||||||
|---|---|---|---|---|---|---|
| Anatomical region | Vox. | x | y | z | BA | Z-value |
| Decrease negative pictures > watch negative pictures | ||||||
| Inferior frontal gyrus | 470 | -52 | 22 | -4 | 47 | 5.06* |
| Inferior frontal gyrus | 464 | 52 | 24 | -10 | 47 | 5.47* |
| Inferior frontal gyrus | 421 | 54 | 18 | 4 | 45 | 5.29* |
| Inferior frontal gyrus | 297 | -54 | 22 | 6 | 45 | 5.07* |
| Inferior frontal gyrus | 156 | -42 | 46 | 8 | 46 | 3.89* |
| Middle frontal gyrus | 496 | -40 | 16 | 44 | 8 | 6.27* |
| Middle frontal gyrus | 370 | 46 | 26 | 40 | 9 | 4.66* |
| Middle frontal gyrus | 283 | -46 | 22 | 36 | 9 | 5.40* |
| Middle frontal gyrus | 414 | 28 | 54 | 20 | 10 | 5.46* |
| Middle frontal gyrus | 142 | 36 | 26 | 38 | 8 | 4.50* |
| Medial frontal gyrus | 515 | -6 | 28 | 44 | 8 | 6.09* |
| Medial frontal gyrus | 515 | 2 | 38 | 48 | 8 | 5.69* |
| Superior frontal gyrus | 433 | -34 | 54 | 20 | 10 | 5.53* |
| Superior frontal gyrus | 496 | 20 | 56 | 28 | 9 | 5.76* |
| Superior frontal gyrus | 512 | 8 | 14 | 66 | 6 | 5.33* |
| Superior frontal gyrus | 515 | -12 | 12 | 69 | 6 | 5.39* |
| Anterior Cingulate gyrus | 118 | -8 | 32 | 32 | 32 | 4.35* |
| Inferior parietal lobule | 506 | -50 | -50 | 46 | 40 | 6.69 |
| Inferior parietal lobule | 514 | 54 | -50 | 50 | 40 | 6.02 |
| Supramarginal gyrus | 281 | 66 | -52 | 30 | 40 | 5.70 |
| Supramarginal gyrus | 239 | -60 | -52 | 38 | 40 | 6.70 |
| Cerebellum | 505 | -40 | -56 | -40 | VIII | 5.60 |
| Cerebellum | 470 | 46 | -62 | -38 | CRII | 5.07 |
| Cerebellum | 51 | -4 | -52 | -22 | V | 3.47 |
| Lingual gyrus | 491 | 4 | -90 | -8 | 18 | 5.05 |
| Middle Temporal gyrus | 373 | 54 | -30 | -8 | 21 | 4.24 |
| Middle Temporal gyrus | 235 | 66 | -34 | -2 | 21 | 3.79 |
| Inferior Temporal gyrus | 279 | -58 | -34 | -16 | 20 | 4.26 |
[i] *significant at p < .05 after applying small volume corrections (see methods section for details).
Table 5
Maxima within regions showing BOLD signal changes in the decrease negative condition versus watch negative condition for training group versus improvisation group after the EC training (second scanning). Note that the contrasts reflect activity relative to the watch positive condition. All coordinates refer to MNI voxel space.
| Training group < Improvisation group | Improvisation group < Training group | ||||||||||
|---|---|---|---|---|---|---|---|---|---|---|---|
| Anatomical region | Voxels | x | y | z | BA | SPM {Z} | Voxels | x | y | z | SPM {Z} |
| Inferior parietal lobule | 422 | -48 | -30 | 50 | 40 | 4.12* | / | ||||
| Inferior parietal lobule | 69 | 40 | -32 | 44 | 40 | 3.39* | / | ||||
| Precentral gyrus | 91 | 30 | -32 | 54 | 4 | 3.22* | / | ||||
| Inferior parietal lobule / intraparietal sulcus | 134 | -32 | -40 | 50 | 3.53* | / | |||||
[i] *significant at p < .05 after applying small volume corrections (see methods section for details).
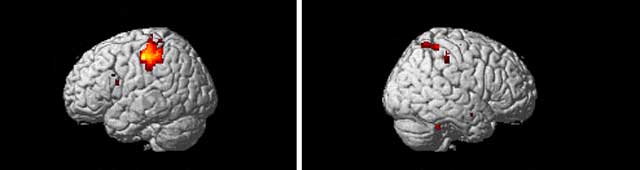
Figure 3
Regions more activated for the control group than the training group for the contrast of decrease > watch for the negative pictures after the EC training (second scanning). Two panels show left and right lateral views of regions more active in the decrease negative – watch negative contrast in the control group.
Table 6
Maxima within regions showing BOLD signal changes in the increase positive condition for training group versus control group after the EC training (second scanning). Note that the contrasts reflect activity relative to the watch positive condition. All coordinates refer to MNI voxel space.
| Training group < Improvisation group | Improvisation group < Training group | ||||||||||
|---|---|---|---|---|---|---|---|---|---|---|---|
| Anatomical region | Voxels | x | y | z | BA | SPM {Z} | Voxels | x | y | z | SPM {Z} |
| Middle frontal gyrus | 432 | 30 | 46 | -2 | 10 | 5.06* | / | ||||
| Orbitofrontal gyrus | 144 | -28 | 46 | -14 | 11 | 3.97* | / | ||||
| Middle frontal gyrus | 223 | 44 | 18 | 48 | 8 | 3.75* | / | ||||
| Frontopolar cortex | 402 | 32 | 54 | -16 | 11 | 4.08* | / | ||||
[i] *significant at p < .05 after applying small volume corrections (see methods section for details).
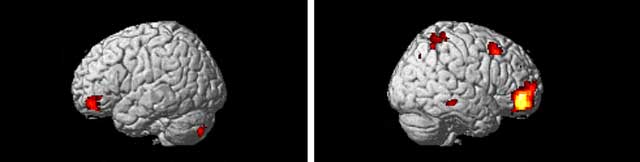
Figure 4
Regions more activated for the control group than the training group for the contrast of increase > watch for the positive pictures after the EC training (second scanning). Two panels show left and right lateral views of regions active in the increase positive – watch positive contrast in the control group.