
Table 1
Descriptive Statistics and Mean-Level Differences based on Analysis of Variance.
| Total Sample | Gender Differences | Age Group Differences | |||||||
|---|---|---|---|---|---|---|---|---|---|
| Males | Females | Partial | Mid-to-late adolescents | Emerging adults | Partial | ||||
| M(SD) | M(SD) | M(SD) | F Ratio | η2 | M(SD) | M(SD) | FRatio | η2 | |
| Identity consolidation | 5.12 (0.74) | 5.22 (0.79) | 5.08 (0.71) | 4.78* | .008 | 5.03 (0.86) | 5.20 (0.71) | 4.01* | .007 |
| Identity disturbance | 2.99 (0.89) | 2.95 (0.93) | 3.01 (0.87) | 0.64 | .001 | 3.17 (0.83) | 2.84 (0.90) | 7.98** | .013 |
| Lack of identity | 2.35 (1.26) | 2.19 (1.20) | 2.43 (1.26) | 4.85* | .008 | 2.31 (1.24) | 2.40 (1.30) | 4.59* | .008 |
| Body dissatisfaction | 3.31 (1.25) | 2.48 (1.02) | 3.68 (1.16) | 161.13*** | .198 | 2.96 (1.10) | 2.96 (0.96) | 1.38 | .002 |
| Drive for thinness | 2.69 (1.21) | 1.96 (0.96) | 3.01 (1.17) | 125.15*** | .160 | 2.68 (1.32) | 2.72 (1.10) | 3.62 | .006 |
| Bulimia | 2.12 (0.78) | 1.89 (0.71) | 2.22 (0.79) | 26.44*** | .039 | 2.17 (0.80) | 2.05 (0.75) | 1.32 | .002 |
[i] Note: M = mean; SD = standard deviation; F = F-value; Partial η2 = partial eta squared.
* p < .05. ** p < .01. ***p < .001.
Table 2
Pearson Correlations between Study Variables.
| Identity consolidation | Identity disturbance | Lack of identity | Body dissatisfaction | Drive for thinness | Bulimia | |
|---|---|---|---|---|---|---|
| Identity consolidation | 1 | |||||
| Identity disturbance | –.60*** | 1 | ||||
| Lack of identity | –.65*** | .63*** | 1 | |||
| Body dissatisfaction | –.35*** | .29*** | .47*** | 1 | ||
| Drive for thinness | –.21*** | .27*** | .34*** | .82*** | 1 | |
| Bulimia | –.30*** | .44*** | .37*** | .51*** | .60*** | 1 |
[i] *** p < .001.
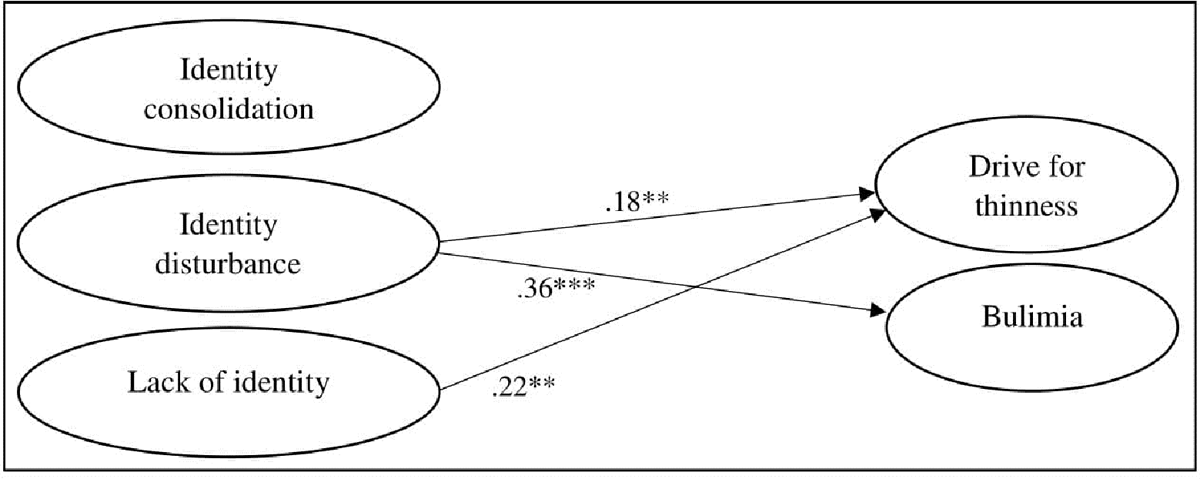
Figure 1
Direct effects model including all significant directional paths among the study variables.
** p < .01. *** p < .001.
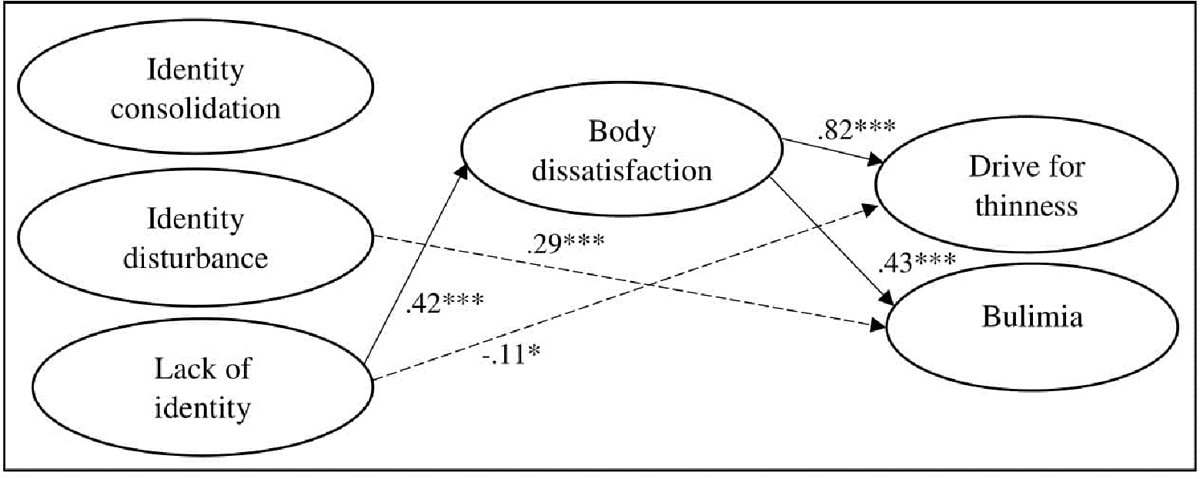
Figure 2
Partial mediation model including all significant directional paths among the study variables.
* p < .05. *** p < .001.