
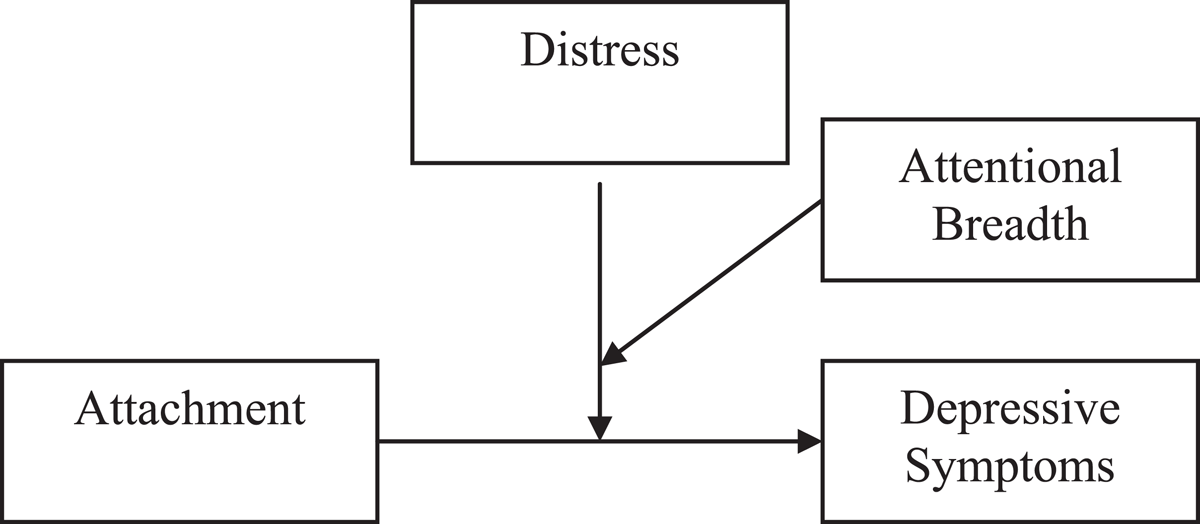
Figure 1
Theoretical Model.
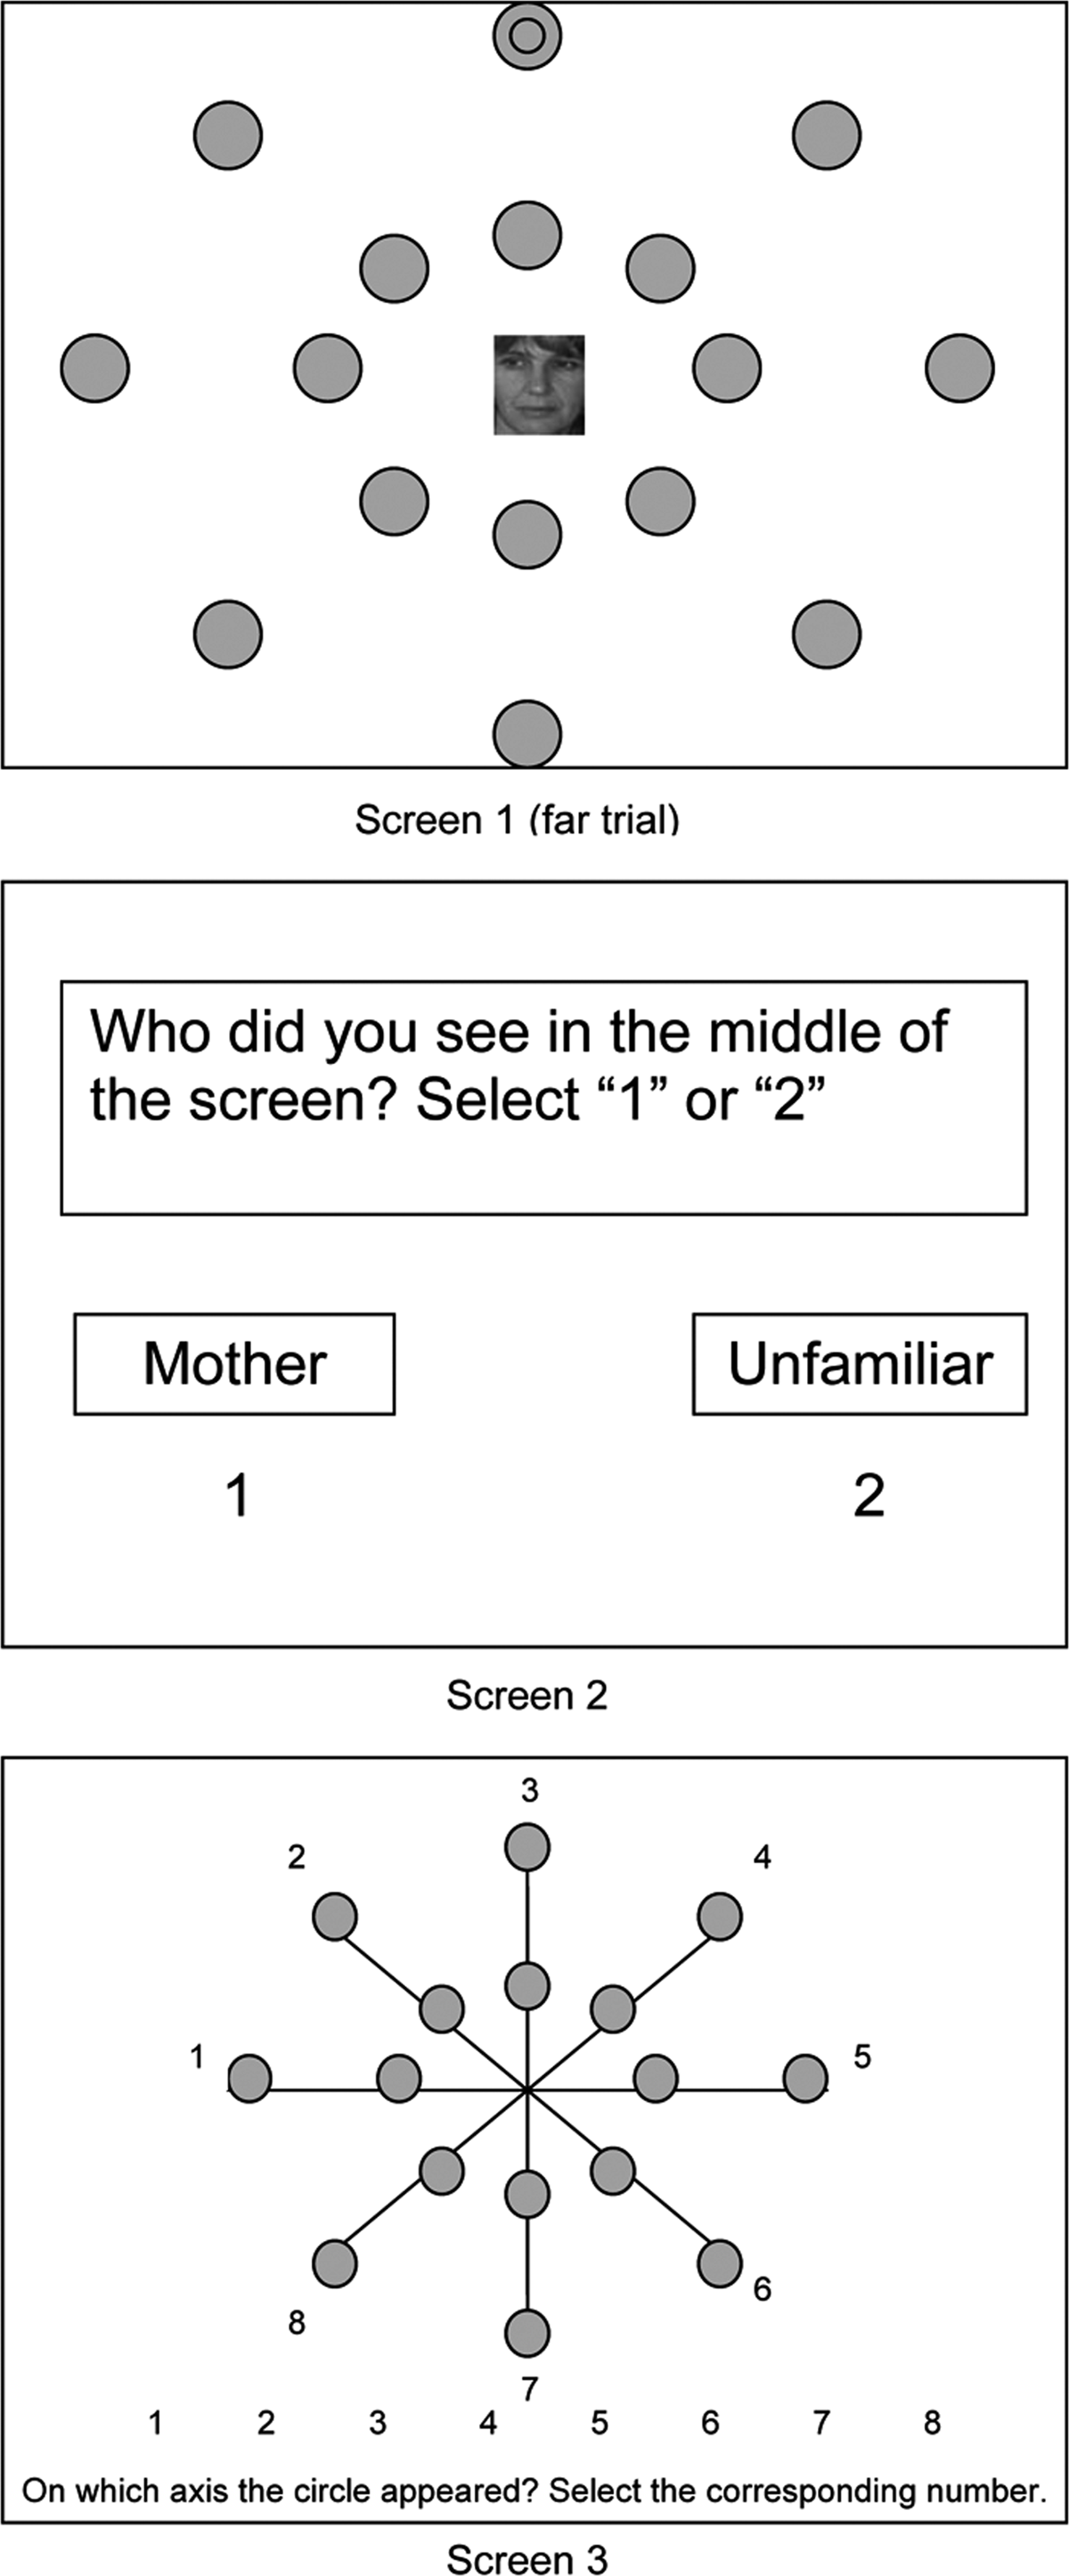
Figure 2
Stimulus presentation of the ABT. From “Attachment security and attentional breadth toward the caregiver in middle childhood” by G. Bosmans, C. Braet, E. Koster and R. De Raedt, 2009, Journal of Clinical Child & Adolescent Psychology, 38, p. 875.
Table 1
Means, Standard Deviations, and Correlation Coefficients Among the Variables (n = 121–157).
| 1 | 2 | 3 | 4 | 5 | 6 | 7 | 8 | 9 | 10 | 11 | ||
|---|---|---|---|---|---|---|---|---|---|---|---|---|
| 1 | Age T1 | 1 | ||||||||||
| 2 | ANE T1 | .10 | 1 | |||||||||
| 3 | Trust T1 | .04 | .02 | 1 | ||||||||
| 4 | Coherence T1 | .22** | .09 | .18* | 1 | |||||||
| 5 | Scriptedness T1 | .22** | .11 | .10 | .45*** | 1 | ||||||
| 6 | Attachment FS T1 | .24** | .10 | .47*** | .83*** | .78*** | 1 | |||||
| 7 | Distress T2 | .06 | –.08 | –.27** | .09 | .00 | –.04 | 1 | ||||
| 8 | Distress T3 | .17† | –.16† | –.32*** | .09 | .10 | –.00 | .49*** | 1 | |||
| 9 | Depressive symptoms T1 | .06 | –.01 | –.50*** | –.05 | .11 | –.15† | .38*** | .27** | 1 | ||
| 10 | Depressive symptoms T2 | .10 | –.04 | –.34*** | –.00 | –.01 | –.13 | .58*** | .36*** | .64*** | 1 | |
| 11 | Depressive symptoms T3 | .26** | –.06 | –.24** | –.01 | .09 | –.04 | .38*** | .62*** | .48*** | .52*** | 1 |
| M | 10.91 | .04 | 3.58 | 5.73 | 3.90 | 0.00 | 0.67 | 0.78 | 0.24 | 0.26 | 0.27 | |
| SD | 0.87 | .13 | 0.35 | 1.33 | 0.74 | 1.00 | 0.39 | 0.46 | 0.18 | 0.18 | 0.20 |
[i] Note: ANE = attentional narrowing effect; Attachment FS = attachment factor score.
† p < .10 * p < .05 ** p < .01 *** p < .001.
Table 2
Multiple Hierarchical Regression Analyses Predicting Change in Depressive Symptoms From Time 1 (T1) to Time 2 (T2) or Time 3 (T3) by ANE, Attachment and Distress (at T2 for T1 to T2 and at T3 for T1 to T3), and Their Two-, and Three-way Interactions.
| T1 to T2 | T1 to T3 | |||||||||
|---|---|---|---|---|---|---|---|---|---|---|
| ΔR2 | ΔF | df | β | f2 | ΔR2 | ΔF | df | β | f2 | |
| Step 1 | .11 | 5.17** | 3,120 | .25 | 12.26*** | 3,109 | ||||
| Age T1 | .09 | .03 | .19** | .07 | ||||||
| Sex T1 | –.01 | .00 | .03 | .00 | ||||||
| Depressive symptoms T1 | –.57*** | .42 | –.63*** | .74 | ||||||
| Step 2 | .22 | 12.72*** | 3,117 | .22 | 14.38*** | 3,106 | ||||
| ANE T1 | .07 | .01 | –.00 | .00 | ||||||
| Attachment T1 | –.10 | .01 | –.07 | .01 | ||||||
| Distress | .42*** | .24 | .46*** | .39 | ||||||
| Step 3 | .05 | 3.35* | 3,114 | .04 | 2.57† | 3,103 | ||||
| ANE T1 × Attachment T1 | –.02 | .00 | .08 | .01 | ||||||
| ANE T1 × Distress | –.24** | .08 | –.13 | .03 | ||||||
| Attachment T1 × Distress | –.06 | .01 | .06 | .01 | ||||||
| Step 4 | .02 | 3.85† | 1,113 | .04 | 9.93** | 1,102 | . | |||
| ANE T1 × Attachment T1 × Distress | –.18† | .03 | –.24** | .10 | ||||||
[i] Note: ANE = attentional narrowing effect; Attachment = attachment factor score; Distress = at T2 for T1 to T2 and at T3 for T1 to T3.
All reported β are values at Step 4 of analysis.
† p = .053 * p < .05 ** p < .01 *** p < .001.
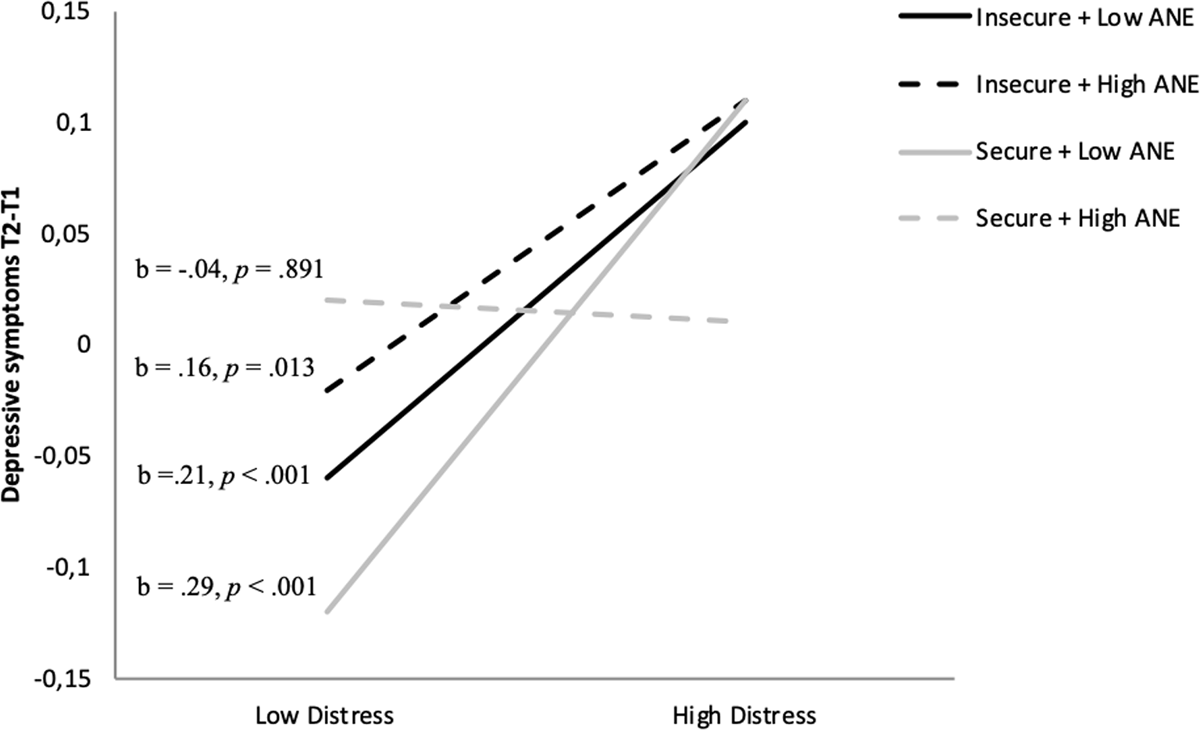
Figure 3
Prediction of change in depressive symptoms from T1 to T2, by the interaction between attachment (secure vs. insecure) and attentional narrowing around mother (high vs. low ANE) at T1 and distress (low vs. high) at T2, controlled for depressive symptoms at T1.
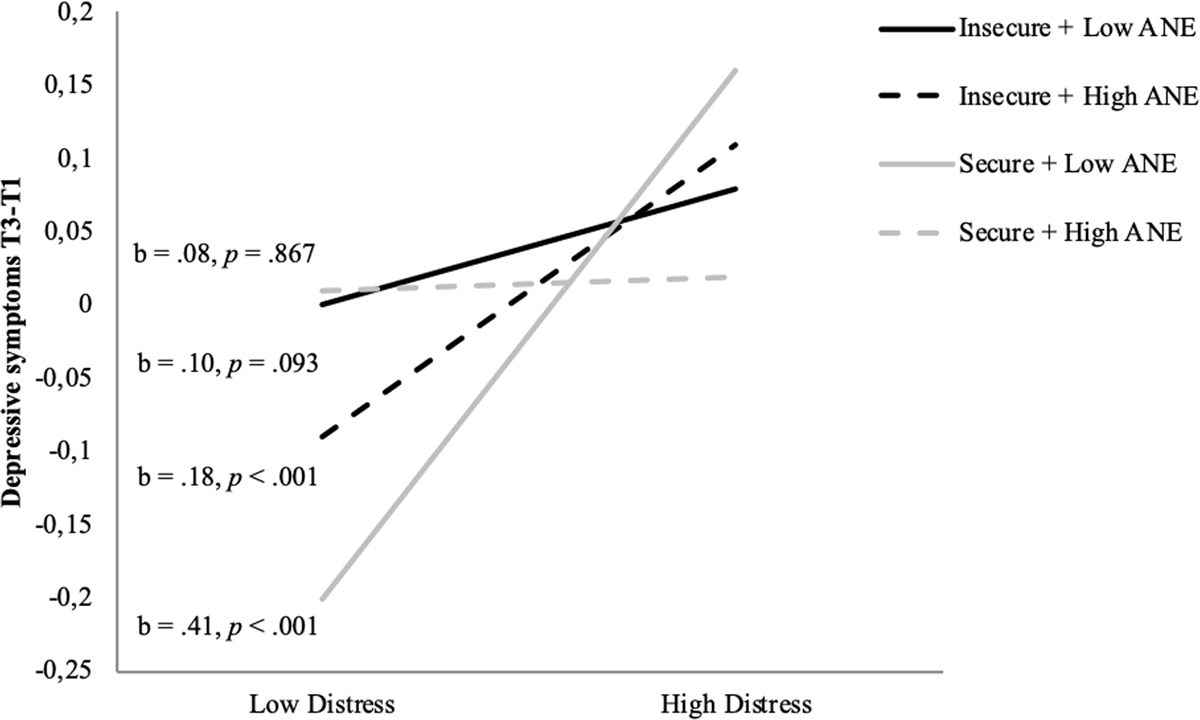
Figure 4
Prediction of change in depressive symptoms from T1 to T3, by the interaction between attachment (secure vs. insecure) and attentional narrowing around mother (high vs. low ANE) at T1 and distress (low vs. high) at T3, controlled for depressive symptoms at T1.