
Table 1
Factorial solutions of the LOII (Ozcanli et al., 2019).
| Two-factor-solution | Factor 1 (Bad-self) | Factor 2 (Bad-outcome) | ||||||||||
|---|---|---|---|---|---|---|---|---|---|---|---|---|
| TR | BE | TR | BE | |||||||||
| .99 | .97 | .98 | .97 | |||||||||
| Six-factor-solution | Factor 1 (Mixed doubts) | Factor 2 (Sexual/religious) | Factor 3 (Contamination) | Factor 4 (Aggressive) | Factor 5 (Illness) | Factor 6 (Religious doubts) | ||||||
| TR | BE | TR | BE | TR | BE | TR | BE | TR | BE | TR | BE | |
| .99 | .97 | .99 | .93 | .98 | .96 | .97 | .94 | .91 | .82 | .92 | .31 | |
[i] Note: Equivalence values based on Tucker coefficients, for the Turkish and Belgian sample. separately. Bold values (Tucker coefficients > .90) represent the dimensions that, in the respective countries, are congruent with dimensions in the pooled sample.
Table 2
Robust fit indexes of the different models according to DWLS estimator.
| Turkey | Belgium | |||||
|---|---|---|---|---|---|---|
| CFI | RMSEA (90% CI) | χ2 | CFI | RMSEA (90% CI) | χ2 | |
| Model 1 | .822 | .070 (.068–.072) | 4707.98*** | NA | NA | NA |
| Model 2 | .894 | .058 (.056–.061) | 2773.89*** | .924 | .057 (.54–.060) | 2209.98*** |
| Model 3 | .948 | .062 (.056–.067) | 560.12*** | .962 | .064 (.057–.071) | 476.37*** |
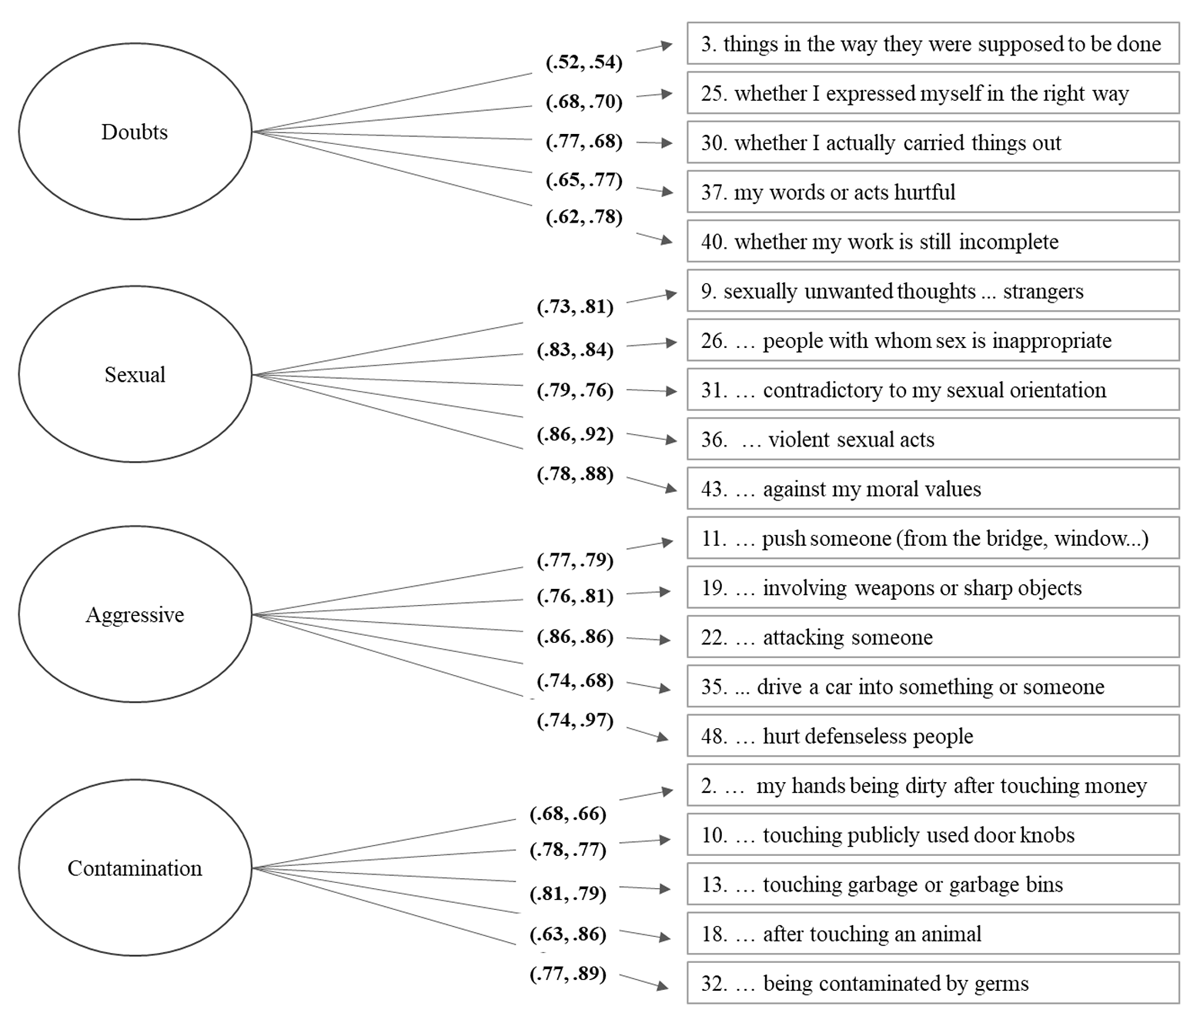
Figure 1
Standardized parameter estimates for Turkish and Belgian LOII-R factor model (Model3). Numbers in parentheses are Turkish followed by Belgian loading estimates; all parameter estimates are significant at p < .001.
Table 3
Measurement invariance for Model-3.
| X2 | ΔX2 | Df | CFI | ΔCFI | RMSEA | ΔRMSEA | |
|---|---|---|---|---|---|---|---|
| Configural | 521.49 | 328 | .982 | .033 | |||
| Metric | 616.64 | 344 | .975 | .038 | |||
| Configural vs metric | 95.15 | .007 | .005 | ||||
| Scalar | 796.78 | 360 | .960 | .047 | |||
| Metric vs scalar | 180.14 | .015 | .009 |
Table 4
Cronbach alpha coefficients of the LOII-R total scale score and its subscales.
| Turkey | Belgium | |
|---|---|---|
| Total score | .84 | .88 |
| Sexual | .84 | .84 |
| Aggressive | .79 | .81 |
| Contamination | .81 | .83 |
| Doubts | .74 | .79 |
Table 5
Zero order correlations between the variables in the Turkish and Belgian samples (upper diagonal represents the correlations in the Turkish sample, the lower diagonal in italics represents the correlations in the Belgian sample).
| LOII-T | LOII-S | LOII-A | LOII-D | LOII-C | PSWQ | PI-T | PI-I | PI-W | PI-C | PI-R | PI-P | |
|---|---|---|---|---|---|---|---|---|---|---|---|---|
| LOII-T | .70** | .70** | .68** | .64** | .33** | .71** | .63** | .61** | .65** | .69** | .56** | |
| LOII-S | .80** | .54** | .25** | .14* | .09 | .34** | .31** | .31* | .34** | .33** | .32** | |
| LOII-A | .77** | .67** | .31** | .17** | .13* | .49** | .48** | .42** | .46** | .43** | .35** | |
| LOII-D | .74** | .39** | .40** | .33** | .50** | .57** | .48** | .47** | .53** | .54** | .52** | |
| LOII-C | .74** | .46** | .39** | .37** | .18** | .49** | .42** | .47** | .48** | .55** | .34** | |
| PSWQ | .26** | .1 | .08 | .40** | .16* | .47** | .41** | .42** | .47** | .48** | .47** | |
| PI-T | .77** | .63** | .58** | .57** | .59** | .29** | .91** | .93** | .92** | .94** | .88** | |
| PI-I | .63** | .60** | .68** | .31** | .36** | .11 | .70** | .80** | .81** | .84** | .76** | |
| PI-W | .65** | .48** | .41** | .31** | .74** | .1 | .78** | .57** | .84** | .86** | .76** | |
| PI-C | .48** | .37** | .29** | .44** | .35** | .21** | .79** | .31** | .48** | .83** | .79** | |
| PI-R | .69** | .51** | .50** | .69** | .39** | .51** | .83** | .53** | .46** | .58** | .79** | |
| PI-P | .46** | .48** | .36** | .26** | .38** | .02 | .75** | .49** | .56** | .57** | .43** |
[i] Note: LOII = Revised Leuven Obsessional Intrusions Inventory, PSWQ = Penn State Worry Questionnaire, and PI = Padua Inventory-Revised, LOII-T = LOII total scale score, LOII-S = LOII Sexual intrusions, LOII-A = LOII Aggressive intrusions, LOII-D = LOII Doubts, LOII-C = LOII Contamination intrusions, PSWQ = PSWQ total score, PI-R-T = Padua Inventory total score, PI-R-I = Padua Inventory Impulses subscale, PI-R-W = Padua Inventory Washing subscale, PI-R-C = Padua Inventory Checking subscale, PI-R-R = Padua Inventory Rumination subscale, and PI-R-P = Padua Inventory Precision subscale. * p < .05, ** p < .01.