
Table 1
Participant characteristics.
| Occupation | Relationship status | n (male/female) | mean age (years) | SD age (years) |
|---|---|---|---|---|
| Secondary student | 66 (27/39) | 17.35 | 0.74 | |
| Single | 38 (17/21) | 17.37 | 0.88 | |
| In a relationship | 25 (8/17) | 17.36 | 0.49 | |
| Complicated | 3 (2/1) | 17.00 | 0.00 | |
| Higher education student | 268 (114/154) | 20.92 | 1.93 | |
| Single | 135 (58/77) | 20.53 | 1.99 | |
| In a relationship | 128 (53/75) | 21.21 | 1.72 | |
| Complicated | 5 (3/2) | 24.00 | 1.41 | |
| Employed | 141 (64/77) | 23.77 | 1.80 | |
| Single | 41 (24/17) | 22.98 | 2.19 | |
| In a relationship | 98 (40/58) | 24.08 | 1.52 | |
| Complicated | 2 (0/2) | 24.50 | 0.71 | |
| Unemployed | 14 (7/7) | 23.36 | 1.50 | |
| Single | 5 (2/3) | 22.80 | 1.94 | |
| In a relationship | 9 (5/4) | 23.67 | 1.23 | |
| Complicated | 0 (0/0) | / | / | |
| 489 (212/277) | 21.33 | 2.676 |
Table 2
Initial Rotated Factor Loadings.
| Item | Is this period in your life a time of… | Factors | 1 | 2 | 3 | 4 | IDEA1 |
|---|---|---|---|---|---|---|---|
| 1 | many possibilities | 0.662 | ExpPos | ||||
| 2 | exploration | 0.758 | ExpPos | ||||
| 3 | experimentation | 0.732 | ExpPos | ||||
| 4 | open choices | 0.714 | ExpPos | ||||
| 5 | trying out new things | 0.764 | ExpPos | ||||
| 6 | feeling adult in some ways but not others | 0.496 | FeelIB | ||||
| 7 | gradually becoming an adult | 0.604 | FeelIB | ||||
| 8 | unsure of having reached full adulthood | 0.546 | FeelIB | ||||
| 9 | finding out who you are | 0.622 | IDExpl | ||||
| 10 | separating from parents | 0.303 | 0.356 | IDExpl | |||
| 11 | defining yourself | 0.509 | 0.408 | IDExpl | |||
| 12 | planning for the future | 0.627 | IDExpl | ||||
| 13 | seeking a sense of meaning | 0.508 | IDExpl | ||||
| 14 | deciding your own beliefs and values | 0.618 | 0.360 | IDExpl | |||
| 15 | learning to think for yourself | 0.612 | 0.305 | IDExpl | |||
| 16 | confusion | 0.411 | 0.542 | NegInst | |||
| 17 | feeling restricted | –0.307 | 0.576 | NegInst | |||
| 18 | feeling stressed out | 0.919 | NegInst | ||||
| 19 | instability | 0.717 | NegInst | ||||
| 20 | high pressure | 0.936 | NegInst | ||||
| 21 | unpredictability | 0.591 | NegInst | ||||
| 22 | many worries | 0.810 | NegInst | ||||
| 23 | settling down | 0.656 | OtherFoc | ||||
| 24 | responsibility for others | 0.477 | OtherFoc | ||||
| 25 | commitments to others | 0.499 | OtherFoc | ||||
| 26 | personal freedom | 0.433 | SelfFoc | ||||
| 27 | responsibility for yourself | 0.450 | SelfFoc | ||||
| 28 | optimism | 0.401 | –0.410 | SelfFoc | |||
| 29 | independence | 0.394 | SelfFoc | ||||
| 30 | focusing on yourself | SelfFoc |
[i] Only factor loadings larger than 0.300 are displayed. Factor loadings smaller than 0.390 are printed in cursive.
1 IDEA subscale = IDEA, Experimentation/possibilities = ExpPos, feeling in-between = FeelIB, identity exploration = IDExpl, negativity/instability = NegInst, other-focus = OtherFoc, and self-focus = SelfFoc.
Table 3
Rotated Factor Loadings Final Model.
| Item | Is this period in your life a time of… | Factors | 1 | 2 | 3 | 4 | IDEA1 |
|---|---|---|---|---|---|---|---|
| 1 | many possibilities | 0.703 | ExpPos | ||||
| 2 | exploration | 0.800 | ExpPos | ||||
| 3 | experimentation | 0.800 | ExpPos | ||||
| 4 | open choices | 0.729 | ExpPos | ||||
| 5 | trying out new things | 0.763 | ExpPos | ||||
| 6 | feeling adult in some ways but not others | 0.693 | FeelIB | ||||
| 7 | gradually becoming an adult | 0.641 | FeelIB | ||||
| 8 | unsure of having reached full adulthood | 0.722 | FeelIB | ||||
| 9 | finding out who you are | 0.493 | IDExpl | ||||
| 12 | planning for the future | 0.612 | IDExpl | ||||
| 18 | feeling stressed out | 0.869 | NegInst | ||||
| 19 | instability | 0.703 | NegInst | ||||
| 20 | high pressure | 0.932 | NegInst | ||||
| 21 | unpredictability | 0.581 | NegInst | ||||
| 22 | many worries | 0.807 | NegInst | ||||
| 23 | settling down | 0.724 | OtherFoc | ||||
| 24 | responsibility for others | 0.460 | OtherFoc | ||||
| 25 | commitments to others | 0.558 | OtherFoc | ||||
| 27 | responsibility for yourself | 0.486 | SelfFoc | ||||
| 29 | independence | 0.436 | SelfFoc |
[i] Only factor loadings larger than 0.300 are displayed.
1 IDEA subscale = IDEA, Experimentation/possibilities = ExpPos, feeling in-between = FeelIB, identity exploration = IDExpl, negativity/instability = NegInst, other-focus = OtherFoc, and self-focus = SelfFoc.
Table 4
Pearson Correlation Coefficients.
| Subscale correlations | ||||||
|---|---|---|---|---|---|---|
| Subscale1 | ExpPos | FeelIB | NegInst | Commit | ||
| ExpPos | ||||||
| Pearson’s r | / | 0.220 | –0.40 | 0.160 | ||
| p-value | / | <0.001 | 0.372 | <0.001 | ||
| FeelIB | ||||||
| Pearson’s r | / | 0.318 | –0.107 | |||
| p-value | / | <0.001 | 0.018 | |||
| NegInst | ||||||
| Pearson’s r | / | –0.056 | ||||
| p-value | / | 0.213 | ||||
| Age | ||||||
| Subscale1 | age (years) | |||||
| ExpPos | ||||||
| Pearson’s r | –0.159 | |||||
| p-value | <0.001 | |||||
| FeelIB | ||||||
| Pearson’s r | –0.216 | |||||
| p-value | <0.001 | |||||
| NegInst | ||||||
| Pearson’s r | –0.193 | |||||
| p-value | <0.001 | |||||
| Commit | ||||||
| Pearson’s r | 0.280 | |||||
| p-value | <0.001 | |||||
| Well-being | ||||||
| Subscale1 | subjective | physical | psychological | social | environment | SCL |
| Pearson’s r | 0.066 | 0.168 | 0.131 | 0.131 | 0.127 | –0.110 |
| p-value | 0.198 | 0.001 | 0.011 | 0.011 | 0.013 | 0.033 |
| FeelIB | ||||||
| Pearson’s r | –0.163 | –0.154 | –0.225 | –0.125 | –0.027 | 0.159 |
| p-value | 0.001 | 0.003 | <0.001 | 0.014 | 0.605 | 0.002 |
| NegInst | ||||||
| Pearson’s r | –0.314 | –0.374 | –0.367 | –0.258 | –0.258 | 0.460 |
| p-value | <0.001 | <0.001 | <0.001 | <0.001 | <0.001 | <0.001 |
| Commit | ||||||
| Pearson’s r | 0.101 | 0.161 | 0.252 | 0.233 | 0.141 | –0.139 |
| p-value | 0.048 | 0.002 | <0.001 | <0.001 | 0.006 | 0.007 |
[i] 1 Experimentation and possibilities = ExpPos, feeling in-between = FeelIB, negativity and instability = NegInst, commitment = Commit, WHOQOL subjectively reported quality of life = subjective, WHOQOL physical quality of life = physical, WHOQOL psychological quality of life = psychological, WHOQOL social quality of life = social, WHOQOL environment quality of life = environment, SCL-90 total raw sum score = SCL.
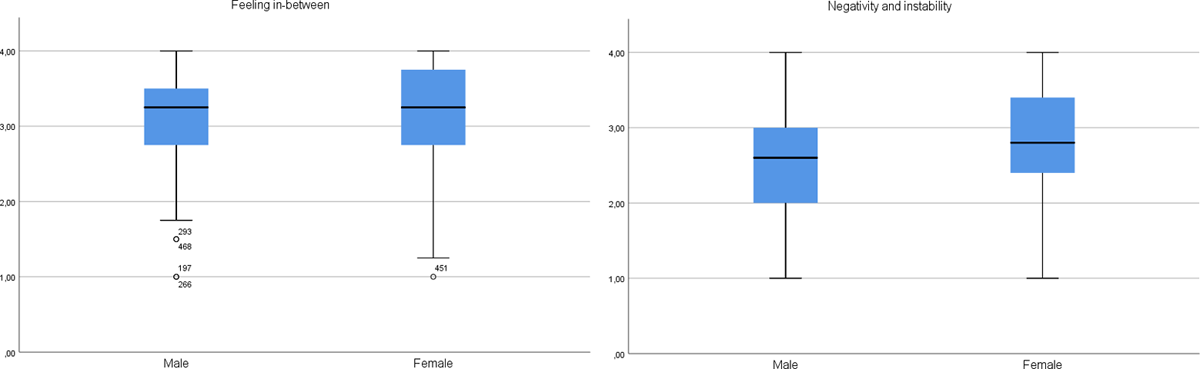
Figure 1
Boxplots of feeling in-between and negativity and instability scores by gender.
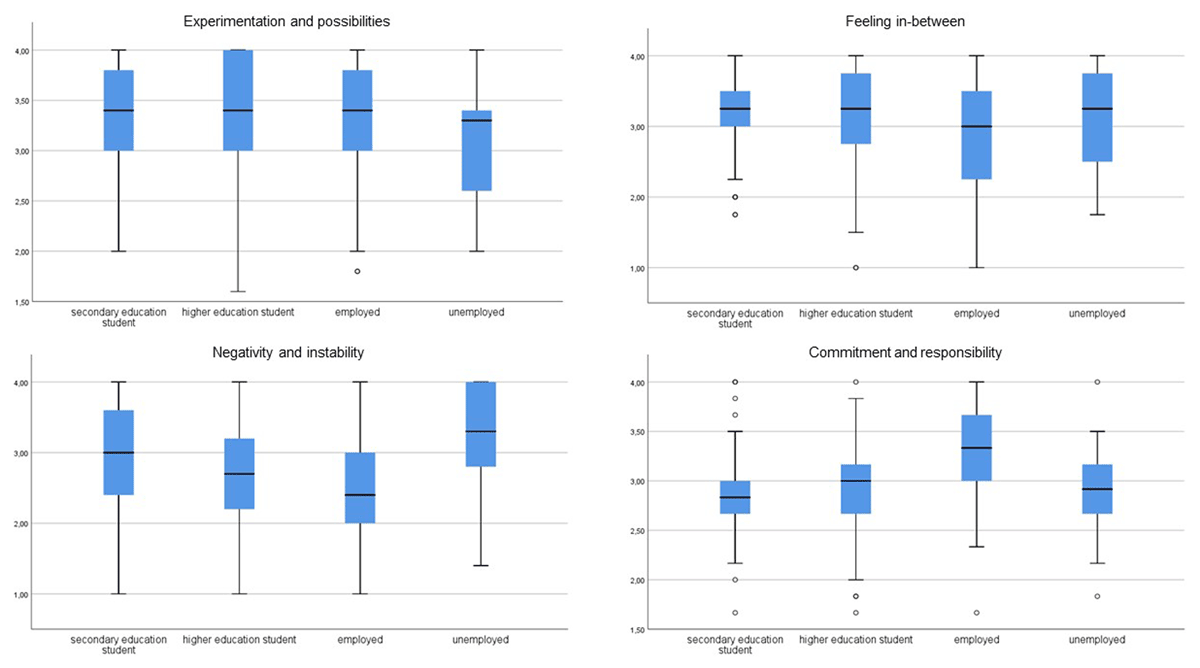
Figure 2
Boxplots of IDEA-BE subscale scores by occupation.
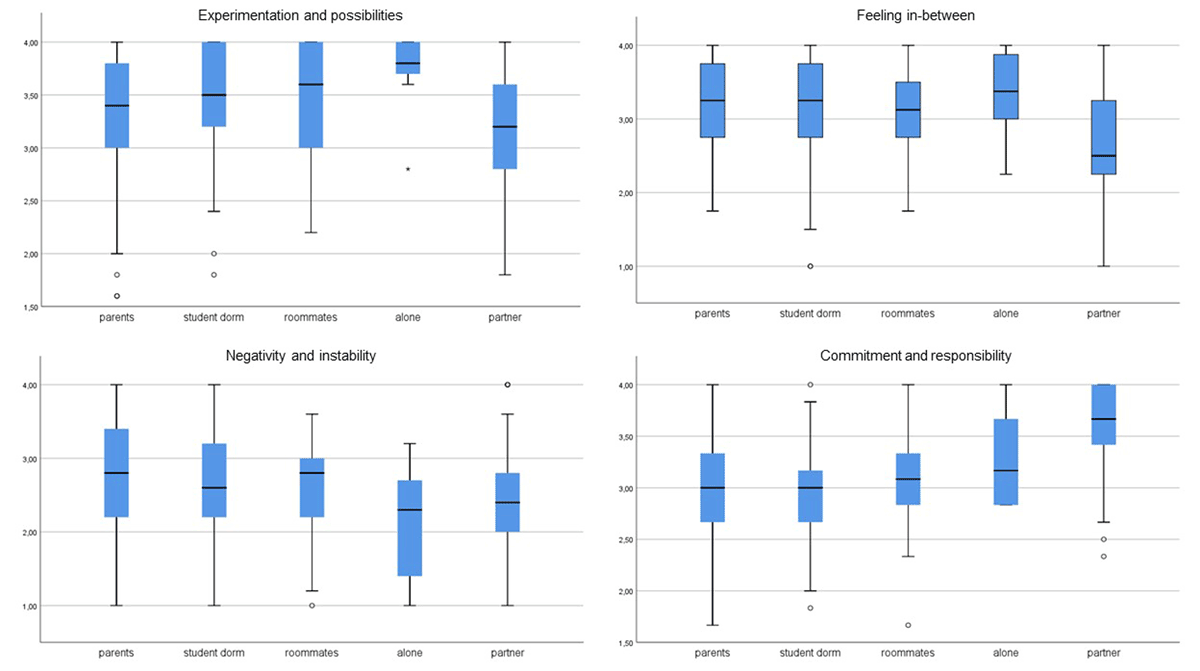
Figure 3
Boxplots of IDEA-BE subscales by place of residence.