
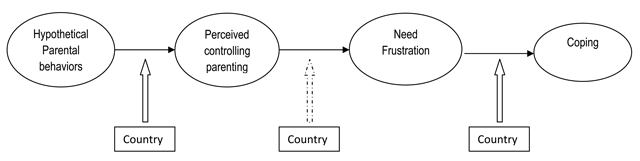
Figure 1
Hypothesized Integrated Model.
Table 1
Descriptive Statistics and Correlations between The Study Variables Across Situations.
| M (SD) Belgium | M (SD) China | 1 | 2 | 3 | 4 | 5 | |
|---|---|---|---|---|---|---|---|
| Perceived controlling parenting | 3.00 (0.98) | 2.91 (0.85) | 1 | .77*** | –.12* | .39*** | .06 |
| Need frustration | 2.76 (0.79) | 2.74 (0.78) | .60*** | 1 | –.04 | .35*** | .01 |
| Compulsive compliance | 2.65 (0.74) | 2.85 (0.98) | .34*** | .36*** | 1 | –.35*** | –.28*** |
| Oppositional defiance | 2.06 (0.79) | 1.99 (0.95) | .25*** | .36*** | –.05 | 1 | –.14** |
| Negotiation | 3.84 (0.72) | 3.52 (1.08) | –.36*** | –.34*** | –.10 | –.30*** | 1 |
[i] Note. Above diagonal are correlations in the Belgian data; below diagonal are correlations in the Chinese data.
*p < .05, **p < .01, ***p < .001.
Table 2
Main Effects of Situation and Interaction with Country (MANCOVA).
| Dependent variables | M (SD) | Between-vignette differences | Country x Vignette effects | ||||||
|---|---|---|---|---|---|---|---|---|---|
| Autonomy-support | Guilt-induction | Generally controlling | F(2,n−2) | F(2,652) | |||||
| Perception of the situation | |||||||||
| Controlling parenting | Total | 2.32 (0.70)a | 3.13 (0.76)b | 3.31 (0.70)b | 83.06*** | 12.12*** | |||
| Belgium | 2.09 (0.86)a | 3.30 (0.85)b | 3.34 (0.82)b | 83.58*** | |||||
| China | 2.55 (0.97)a | 2.96 (0.92)b | 3.29 (0.85)c | 16.54*** | |||||
| Need frustration | Total | 2.32 (0.86)a | 2.89 (0.82)b | 3.00 (0.80)b | 55.65*** | 15.90*** | |||
| Belgium | 2.04 (0.51)a | 3.01 (0.72)b | 2.91 (0.70)b | 68.59*** | |||||
| China | 2.60 (0.80)a | 2.77 (0.76)a | 3.09 (0.70)b | 12.11*** | |||||
| Coping responses | |||||||||
| Compulsive compliance | Total | 2.63 (0.83)a | 2.80 (0.84)ab | 2.84 (0.92)b | 4.31* | 6.76** | |||
| Belgium | 2.75 (0.69)a | 2.71 (0.73)a | 2.64 (0.80)a | 0.35 | |||||
| China | 2.51 (0.95)a | 2.89 (0.94)b | 3.05 (0.98)b | 9.75*** | |||||
| Oppositional defiance | Total | 1.89 (0.82)a | 2.08 (0.82)ab | 2.13 (0.93)b | 4.47* | 0.79 | |||
| Belgium | 1.85 (0.72)a | 2.07 (0.73)ab | 2.19 (0.92)b | 4.48* | |||||
| China | 1.93 (0.90) | 2.09 (0.94) | 2.06 (0.95) | 0.70 | |||||
| Negotiation | Total | 3.66 (0.95)a | 3.63 (0.87)a | 3.70 (0.94)a | 0.07 | 2.06 | |||
| Belgium | 3.71 (0.71) | 3.82 (0.71) | 3.94 (0.74) | 2.21 | |||||
| China | 3.61 (1.14) | 3.45 (1.02) | 3.47 (1.07) | 0.65 | |||||
[i] Note. Means within rows with different superscripts are significantly different (post hoc Tukey contrasts; p < 05).
*p < .05, **p < .01, ***p < .001.
Table 3
Tests of Path Coefficient Equivalence between the Belgian and Chinese Samples.
| Model | SBSX2 | df | CFI | SRMR | RMSEA | Model Comparisons | |
|---|---|---|---|---|---|---|---|
| Comparison | Δ SBSX2 | ||||||
| Model 1: No constraints (baseline model) | 715.62*** | 401 | .93 | .07 | .05 | ||
| Model 2: Fully constrained model | 815.45*** | 407 | .91 | .10 | .06 | vs. model 1 | 99.83*** |
| Model 3: Fixed path from AS vs. Guilt-induction to PC | 761.96*** | 402 | .92 | .07 | .05 | vs. model 1 | 46.34*** |
| Model 4: Fixed path from Control vs. Guilt-induction to PC | 720.33*** | 402 | .93 | .07 | .05 | vs. model 1 | 4.71* |
| Model 5: Fixed path from PC to Need Frustration | 719.00*** | 402 | .93 | .07 | .05 | vs. model 1 | 3.38 |
| Model 6: Fixed path from Needs to Compliance | 743.93*** | 402 | .92 | .08 | .05 | vs. model 1 | 28.31*** |
| Model 7: Fixed path from Needs to Defiance | 716.04*** | 402 | .93 | .07 | .05 | vs. model 1 | 0.42 |
| Model 8: Fixed path from Needs to Negotiation | 740.53*** | 402 | .93 | .08 | .05 | vs. model 1 | 24.91*** |
[i] Note. AS = Autonomy-Support; PC = Perceived Controlling style.
*p < .05, **p < .01, ***p < .001.
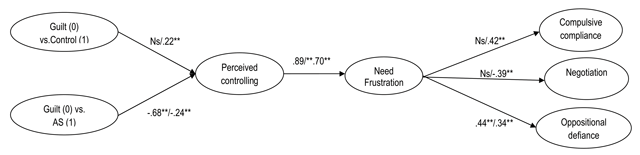
Figure 2
SEM Model. Note. *p < .05; **p < .01, ***p < .001. The first coefficient refers to the Belgian sample and the second coefficient refers to the Chinese sample. SBS-χ2 (403) = 719.54, p < .01; CFI = .93; SRMR = .07; RMSEA = .05; AS = Autonomy-Support.