
Table 1
BPNSFS. Global Fit Indices for the Measurement Models Tested. Multiple-group Analysis.
| Confirmatory Factor Analysis | χ2 | df | CFI | RMSEA | SRMR | AIC | Comparison of models | ||
|---|---|---|---|---|---|---|---|---|---|
| Δχ2 | Δdf | p-value | |||||||
| Measurement Models | |||||||||
| 6-factor model (Sample1) | 519.13 | 237 | .95 | .05 | .06 | 645.13 | |||
| 3+2 factor model (Sample 1) | 546.30 | 227 | .94 | .06 | .08 | 694.30 | |||
| 2-factor model (Sample 1) | 852.81 | 235 | .89 | .08 | .07 | 982.81 | |||
| 6-factor model (Sample2) | 245.40 | 120 | .97 | .05 | .04 | 347.40 | |||
| 2-factor model (Sample 2) | 298.93 | 128 | .95 | .05 | .05 | 384.93 | |||
| Multiple‑group analysis for age | |||||||||
| Unconstrained | 397.43 | 240 | .96 | .04 | .06 | ||||
| Measurement weights | 410.60 | 252 | .96 | .40 | .70 | Δχ2 = 13.17 | Δdf = 12 | .36 | |
| Structural covariances | 444.92 | 273 | .96 | .40 | .10 | Δχ2 = 47.49 | Δdf = 33 | .05 | |
| Measurement residuals | 553.18 | 291 | .93 | .05 | .10 | Δχ2 = 155.76 | Δdf = 51 | .01 | |
[i] Note1: χ2 = qui-square; CFI = comparative fit index; RMSEA = Root Mean Square Error of Approximation; SRMR = Standardized Root Mean Square Residual; AIC = Akaike Information Criterion; p < 0.0001; Δχ2 = Qui-Square Difference; ΔCFI = Difference in Comparative Fit Index; “Bold” values indicate non-significant changes in model fit.
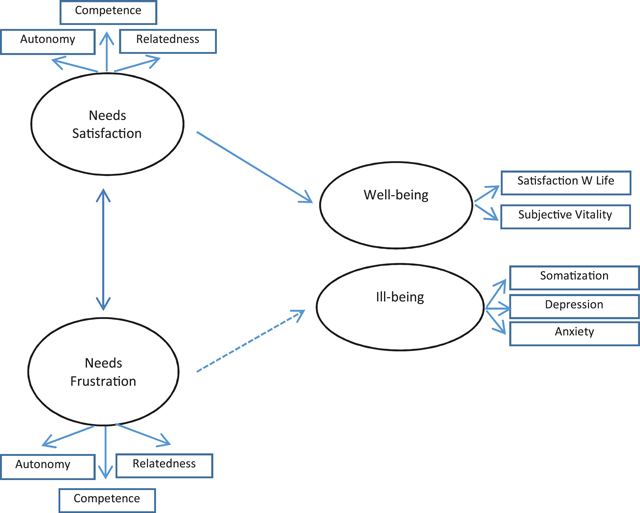
Figure 1
Model Overview. SEM Model 1 and 2. Note: Solid line: Model 1; Dotted line: Model 2.
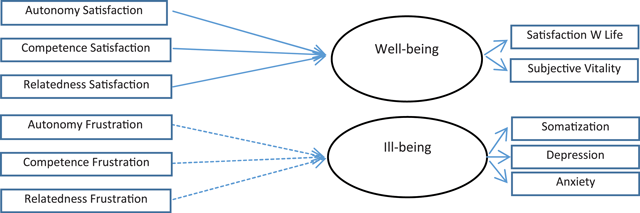
Figure 2
Model Overview. SEM Model 3 to 5. Note: Solid line: Model 3; Dotted line: Model 4. Model 5 specifies the six predictors simultaneously.
Table 2
BPNSFS. Means, Standard Deviations, Range and Internal Consistency of the Variables (Study 1).
| Variables | N | Minimum | Maximum | Mean | SD | Alpha | Zero-order correlations | ||||||||||||
|---|---|---|---|---|---|---|---|---|---|---|---|---|---|---|---|---|---|---|---|
| Autonomy Satisfaction | 417 (755) | 1.67 (1.00) | 6.00 (6.00) | 4.87 (4.58) | 0.82 (.90) | .76 (76) | 1 | 2 | 3 | 4 | 5 | 6 | 7 | 8 | 9 | 10 | 11 | 12 | 13 |
| Autonomy Frustration | 417 (755) | 1.00 (1.00) | 5.00 (6.00) | 2.20 (2.42) | 0.92 (.97) | .85 (70) | 1 | –.39** | .51** | –.38** | .51** | –.32** | .46** | .36** | –.15** | –.32** | –.12** | .80** | –.43** |
| Competence Satisfaction | 417 (755) | 1.00 (1.00) | 6.00 (6.00) | 4.83 (4.72) | 0.88 (.83) | .85 (73) | –.50** | 1 | –.28** | .50** | –.47** | .55** | –.32** | –.28** | .28** | .43** | .21** | –.47** | .80** |
| Competence Frustration | 417 (755) | 1.00 (1.00) | 6.00 (6.00) | 2.13 (2.50) | 1.04 (1.0) | .74 (73) | .62** | –.39** | 1 | –.58** | .42** | –.29** | .41** | .37** | –.23** | –.37** | –.19** | .81** | –.46** |
| Relatedness Satisfaction | 417 (755) | 1.25 (1.75) | 6.00 (6.00) | 5.25 (5.16) | 0.78 (.80) | .78 (73) | –.46** | .46** | –.72** | 1 | –.35** | .56** | –.40** | ––.34** | .43** | .58** | .34** | –.54** | .84** |
| Relatedness Frustration | 417 (755) | 1.00 (1.00) | 6.00 (5.75) | 1.80 (1.97) | 0.88 (.98) | .80 (70) | .63** | –.47** | .59** | ––.49** | 1 | –.60** | .39** | .33** | –.17** | –.37** | –.15** | .79** | –.55** |
| Satisfaction With Life | 417 (755) | 1.00 (1.00) | 6.00 (5.00) | 1.96 (2.10) | 0.79 (.93) | .85 (.82) | –.50** | .51** | –.56** | .61** | –.75** | 1 | –.33** | –.27** | .27** | .45** | .28** | –.51** | .84** |
| Vitality | 417 (755) | 1.00 (1.00) | 7.00 (5.00) | 1.97 (2.12) | 0.87 (.93) | .89 (.92) | .49** | –.47** | .48** | –.50** | .47** | –.42** | 1 | .49** | –.31** | –.53** | –.20** | .44** | –.36** |
| Anxiety | 417 (755) | 1.00 (1.00) | 5.00 (5.00) | 1.69 (1.63) | 0.74 (.70) | .70 (.70) | .44** | –.28** | .54** | –.54** | .49** | –.41** | .53** | 1 | –.28** | –.43** | –.26** | .53** | –.42** |
| Depression | 417 (755) | 1.00 (1.00) | 5.00 (5.00) | 4.99 (4.83) | 0.70 (.65) | .87 (.83) | –.31** | .34** | –.39** | .49** | –.33** | .40** | –.36** | –.39** | 1 | .66** | .69** | –.23** | .39** |
| Somatization | 417 (755) | 1.00 (1.00) | 7.00 (5.00) | 2.02 (2.44) | 0.79 (.81) | .82 (.80) | –.40** | .38** | –.52** | .65** | –.47** | .51** | –.56** | –.56** | .73** | 1 | .49** | –.44** | .58** |
| General Satisfaction | 417 (755) | 1.78 (2.25) | 6.00 (6.00) | 3.74 (3.46) | 0.86 (.95) | .90 (81) | –.14** | .21** | –.25** | .32** | –.22** | .27** | –.26** | –.23** | .63** | .49** | 1 | –.20** | .33** |
| General Frustration | 417 (755) | 1.00 (1.00) | 4.89 (5.50) | 4.67 (3.90) | 1.15 (.83) | .88 (83) | .85** | –.52** | .87** | –.66** | .85** | –.69** | .55** | .58** | –.40** | –.54** | –.24** | 1 | –.59** |
[i] Note: values under brackets refer to the descriptives at T1 high school students **.p < .01 level ; *. P < 0.05. Note: SD = Standard Deviation; Intercorrelations, Mean and SD at the lower and upper diagonal refer respectively at the samples of undergraduate (N = 417) and high school students at T1 (N = 755), respectively.