
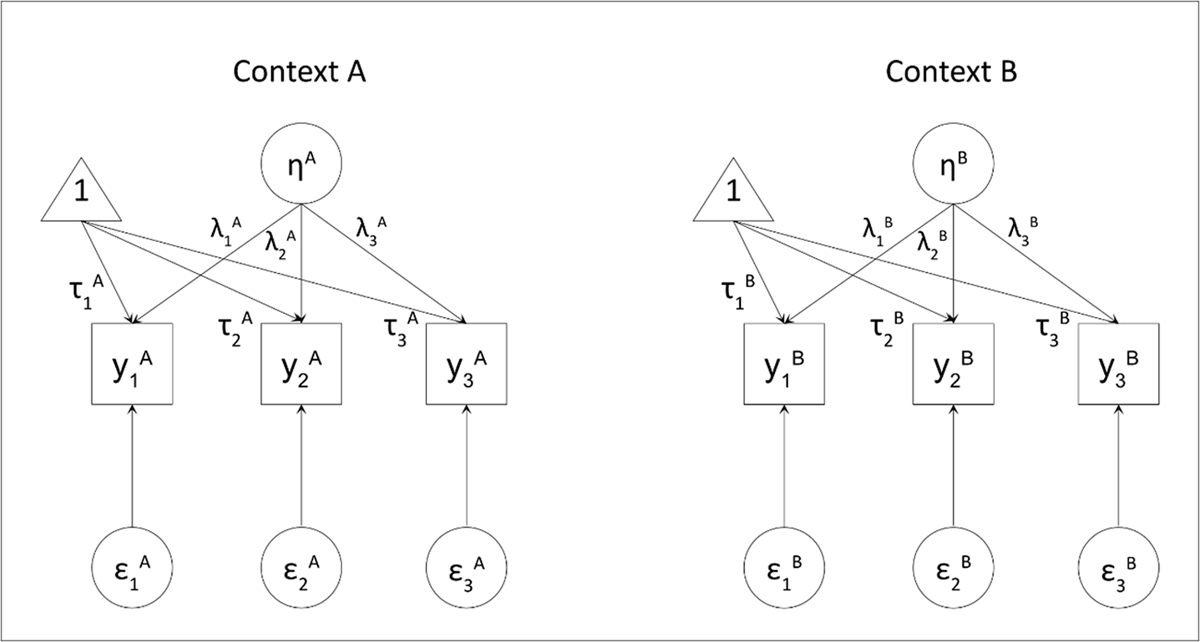
Figure 1
Confirmatory Factor Analysis of Construct η at time points A and B, with Indicators yi, Factor Loadings λi, Item Intercepts τi, and Item Error Variances Var(ɛi).
Note. A and B refer to two time points. To avoid clutter, the covariances between the latent variables and between the time-specific observations of the items are not displayed.
Table 1
Studies Investigating the LMI of the PSS-10, MBI, and PANAS.
| FIRST AUTHOR, YEAR OF PUBLICATION, TITLE | SCALE VERSION | POPULATION AND LOCATION | DESIGN | N | LMI LEVELS TESTED | LMI LEVELS SUPPORTED |
|---|---|---|---|---|---|---|
| Jiang et al. (2023): Validation of the Chinese version of the Perceived Stress Scale-10 integrating exploratory graph analysis and confirmatory factor analysis | PSS-10, Chinese | University students, China | 2 waves, 1-week interval | 492 | Configural Metric Scalar Residual | Configural Metric Scalar Residual |
| Reis et al. (2019): The German Version of the Perceived Stress Scale (PSS-10): Evaluation of Dimensionality, Validity, and Measurement Invariance With Exploratory and Confirmatory Bifactor Modeling | PSS-10, German | Adult participants of six RCTs testing the same stress management training, Germany | 2 waves, 8-week interval | 1862 | Configural Metric Scalar | Configural Metric Scalar |
| Isik Akin et al. (2024): Parent-Child Relationship, Well-Being and Home-Leaving during the Transition from High School to University | PSS-10, Turkish | University students, Turkey | 2 waves, 18-month interval | 240 | Configural Metric Scalar | Configural Metric Scalar |
| Shields et al. (2016): Stress-related changes in personality: A longitudinal study of perceived stress and trait pessimism | PSS-10, English | Young, middle, and older adults from college campuses and surrounding community, USA | 5 waves, 1-week intervals | 332 | Configural Metric Scalar | Configural Metric Scalar |
| Barbosa-Leiker et al. (2013): Measurement Invariance of the Perceived Stress Scale and Latent Mean Differences across Gender and Time | PSS-10, English | Participants of the Spokane Heart Study: asymptomatic, community-dwelling adults, USA | 2 waves, 2-year interval | 871 | Configural Metric Scalar | Configural Metric Scalar |
| Turhan et al. (2021): Psychometric Properties of the German Short Version of the Maslach Burnout Inventory - Student Survey | MBI short student version, German | University students, Germany | 3 waves, 6-week intervals | 1435 | Configural Metric Scalar Residual | Configural Metric Scalar Residual |
| Giusti et al. (2022): The North Italian Longitudinal Study Assessing the Mental Health Effects of SARS-CoV-2 Pandemic Health Care Workers—Part II: Structural Validity of Scales Assessing Mental Health. | MBI, Italian | University hospital staff, Italy | 2 waves, 16-month interval | 369 | Configural Metric Scalar | Configural Metric |
| Kim et al. (2009): Factor Structure and Longitudinal Invariance of the Maslach Burnout Inventory | MBI, English | Social workers, USA | 2 waves, 1-year interval | 282 | Configural Metric | Configural Metric (partial) |
| Mäkikangas et al. (2011): Longitudinal factorial invariance of the Maslach Burnout Inventory-General Survey among employees with job-related psychological health problems | MBI, Finnish | Employees who participated in two different rehabilitation intervention programs, Finland | 2 waves, 4-month interval | 155 | Configural Metric Residual | Configural Metric Residual |
| Schnitker et al. (2020): Bidirectional associations across time between entitativity, positive affect, generosity, and religiousness in adolescents training with a religiously affiliated charity marathon team | PANAS adapted for children, English | Adolescents and emerging adults from running teams, USA | 3 waves, 15-week interval between T1 and T2, 3-week interval between T2 and T3 | 396 | Configural Metric Scalar | Configural Metric Scalar |
| Jønsson et al. (2022): The savvy and cheerful employee innovation champions: The roles of political skill and trait-positive affect in employees’ championing and salary levels | Positive affect items of the PANAS short form, Danish | Employees from a branch of a global IT consultancy company, Denmark | 3 waves, 4-month intervals | 152 | Configural Metric Scalar | Configural Metric Scalar |
| Belkin et al. (2022): Beliefs in government benevolence can promote individuals’ compliance with government-issued guidelines: The role of positive affect and general construal level | Positive affect items of the PANAS short form, English | Adult Mechanical Turk participants, USA | 2 waves, 2-week interval | 195 | Configural Metric Scalar | Configural Metric Scalar |
| Xiang et al. (2023): Development of self-concept clarity from ages 11 to 24: Latent growth models of Chinese adolescents | Positive Affect subscale of the PANAS, Chinese | Adolescents, China | 3 waves, 6-month intervals | 2001 | Configural Metric Scalar | Configural Metric |
Table 2
Means, Standard Deviations, Range, and Reliabilities for all Scales at T1, T2, and T3.
| SCALE | T1 | T2 | T3 | ||||||
|---|---|---|---|---|---|---|---|---|---|
| M(SD) | RANGE | ω | M(SD) | RANGE | ω | M(SD) | RANGE | ω | |
| PSS a | 2.72(0.64) | 1–5 | 0.90 | 2.65(0.59) | 1–5 | 0.89 | 2.55(0.71) | 1–5 | 0.94 |
| EEX a | 2.71(0.84) | 1–5 | 0.89 | 2.65(0.83) | 1–5 | 0.90 | 2.58(0.88) | 1–5 | 0.91 |
| NA b | 2.55(0.62) | 1–5 | 0.80 | 2.49(0.66) | 1–5 | 0.85 | 2.38(0.68) | 1–5 | 0.86 |
| PA b | 3.40(0.57) | 1–5 | 0.87 | 3.45(0.55) | 1–5 | 0.87 | 3.49(0.62) | 1–5 | 0.90 |
[i] Note. PSS = Perceived Stress Scale; EEX = Maslach Burnout Inventory, Educators Survey, Emotional Exhaustion subscale; NA = PANAS, Negative Affect subscale; PA = PANAS, Positive Affect subscale; ω = McDonald’s omega.
a N for PSS and EEX = 237.
b N for NA and PA = 236.
Table 3
Goodness-of-Fit Statistics for the Confirmatory Factor Analyses testing the Unidimensional Structure of all Scales, T1.
| SCALE | χ2 (df) | p | RMSEA [90% CI] | SRMR | CFI |
|---|---|---|---|---|---|
| PSS a | 91.57 (35) | <0.001 | 0.083 [0.062, 0.103] | 0.040 | 0.948 |
| EEX a | 87.45 (27) | <0.001 | 0.097 [0.075, 0.120] | 0.041 | 0.939 |
| NA b | 62.02 (27) | <0.001 | 0.074 [0.050, 0.099] | 0.054 | 0.949 |
| PA b | 78.01 (26) | <0.001 | 0.092 [0.069, 0.116] | 0.045 | 0.939 |
[i] Note. PSS = Perceived Stress Scale; EEX = Maslach Emotional Exhaustion subscale; NA = PANAS Negative Affect subscale; PA = PANAS Positive Affect subscale; df = degrees of freedom; RMSEA = root mean square error of approximation; CI = confidence interval; SRMR = standardized root mean square residual; CFI = comparative fit index.
a N for PSS and EEX = 237.
b N for NA and PA = 236.
Table 4
Model Fit Indices for the Longitudinal Configural, Metric, Scalar, Residual, and Partial Residual Invariant Models for Perceived Stress Scale (PSS-10).
| LEVEL | GOODNESS-OF-FIT | MODEL COMPARISON | |||||||
|---|---|---|---|---|---|---|---|---|---|
| χ2 (df) P | RMSEA [90% CI] | SRMR | CFI | REF. MODEL | Δχ2 (Δdf) P | ΔRMSEA | ΔSRMR | ΔCFI | |
| Configural | 598.36 (372) *** | 0.051 [0.043, 0.058] | 0.065 | 0.916 | |||||
| Metric | 615.90 (390) *** | 0.049 [0.042, 0.057] | 0.074 | 0.916 | Configural | 17.54 (18) n.s. | –0.002 | +0.009 | +0.000 |
| Scalar | 634.83 (408) *** | 0.048 [0.041, 0.056] | 0.074 | 0.916 | Metric | 18.93 (18) n.s. | –0.001 | +0.000 | +0.000 |
| Residual | 685.18 (428) *** | 0.050 [0.043, 0.057] | 0.093 | 0.905 | Scalar | 50.34 (20) *** | +0.002 | +0.019 | –0.011 |
| Partial residual | 655.82 (422) *** | 0.048 [0.041, 0.055] | 0.083 | 0.913 | Scalar | 20.99 (14) n.s. | +0.000 | +0.009 | –0.003 |
[i] Note. df = degrees of freedom; RMSEA = root mean square error of approximation; CI = confidence interval; SRMR = standardized root mean square residual; CFI = comparative fit index; Ref. model = reference model; N = 237.
*** p < 0.001; n.s. = not significant.
Table 5
Model Fit Indices for the Longitudinal Configural, Metric, Scalar, and Residual Invariant Models for Maslach Burnout Inventory, Educators Survey (MBI-ES), Emotional Exhaustion subscale.
| LEVEL | GOODNESS-OF-FIT | MODEL COMPARISON | |||||||
|---|---|---|---|---|---|---|---|---|---|
| χ2(df) P | RMSEA [90% CI] | SRMR | CFI | REF. MODEL | Δχ2 (Δdf) P | ΔRMSEA | ΔSRMR | ΔCFI | |
| Configural | 483.15 (294) *** | 0.052 [0.044, 0.060] | 0.069 | 0.923 | |||||
| Metric | 496.43 (310) *** | 0.050 [0.042, 0.058] | 0.074 | 0.925 | Configural | 13.28 (16) n.s. | –0.002 | +0.005 | +0.002 |
| Scalar | 521.32 (326) *** | 0.050 [0.042, 0.058] | 0.076 | 0.921 | Metric | 24.89 (16) n.s. | +0.000 | +0.002 | –0.004 |
| Residual | 540.63 (344) *** | 0.049 [0.041, 0.057] | 0.082 | 0.920 | Scalar | 19.30 (18) n.s. | –0.001 | +0.006 | –0.001 |
[i] Note. df = degrees of freedom; RMSEA = root mean square error of approximation; CI = confidence interval; SRMR = standardized root mean square residual; CFI = comparative fit index; Ref. model = reference model; N = 237.
*** p < 0.001; n.s. = not significant.
Table 6
Model Fit Indices for the Longitudinal Configural, Metric, Scalar, and Residual Invariant Models Positive and Negative Affect Schedule (PANAS), Negative Affect subscale.
| LEVEL | GOODNESS-OF-FIT | MODEL COMPARISON | |||||||
|---|---|---|---|---|---|---|---|---|---|
| χ2(df) P | RMSEA [90% CI] | SRMR | CFI | REF. MODEL | Δχ2 (Δdf) P | ΔRMSEA | ΔSRMR | ΔCFI | |
| Configural | 557.11 (348) *** | 0.050 [0.043, 0.058] | 0.085 | 0.895 | |||||
| Metric | 579.46 (366) *** | 0.050 [0.042, 0.057] | 0.092 | 0.893 | Configural | 22.35 (18)n.s. | +0.000 | +0.007 | –0.002 |
| Scalar | 612.71 (384) *** | 0.050 [0.042, 0.057] | 0.093 | 0.885 | Metric | 33.25 (18) * | +0.000 | +0.001 | –0.008 |
| Partial scalar | 602.66 (380) *** | 0.050 [0.042, 0.057] | 0.093 | 0.888 | Metric | 23.21 (14) n.s. | +0.000 | +0.001 | –0.005 |
| Residual | 621.62 (400) *** | 0.048 [0.041, 0.056] | 0.097 | 0.889 | Partial scalar | 18.96 (20) n.s. | –0.002 | +0.004 | +0.001 |
[i] Note. df = degrees of freedom; RMSEA = root mean square error of approximation; CI = confidence interval; SRMR = standardized root mean square residual; CFI = comparative fit index; Ref model = reference model; N = 236.
*** p < 0.001; * p < 0.05; n.s. = not significant.
Table 7
Model Fit Indices for the Longitudinal Configural, Metric, Scalar, and Residual Invariant Models Positive and Negative Affect Schedule (PANAS), Positive Affect subscale.
| LEVEL | GOODNESS-OF-FIT | MODEL COMPARISON | |||||||
|---|---|---|---|---|---|---|---|---|---|
| χ2(df) P | RMSEA [90% CI] | SRMR | CFI | REF. MODEL | Δχ2 (Δdf) P | ΔRMSEA | ΔSRMR | ΔCFI | |
| Configural | 601.62 (345) *** | 0.056 [0.049, 0.064] | 0.082 | 0.887 | |||||
| Metric | 619.28 (363) *** | 0.055 [0.047, 0.062] | 0.090 | 0.887 | Configural | 17.67 (18) n.s. | –0.001 | +0.008 | +0.000 |
| Scalar | 635.63 (381) *** | 0.053 [0.046, 0.060] | 0.091 | 0.888 | Metric | 16.35 (18) n.s. | –0.002 | +0.001 | +0.001 |
| Residual | 651.02 (401) *** | 0.051 [0.044, 0.058] | 0.093 | 0.890 | Scalar | 15.39 (20) n.s. | –0.002 | +0.002 | +0.002 |
[i] Note. df = degrees of freedom; RMSEA = root mean square error of approximation; CI = confidence interval; SRMR = standardized root mean square residual; CFI = comparative fit index; Ref model = reference model; N = 236.
*** p < 0.001; n.s. = not significant.