
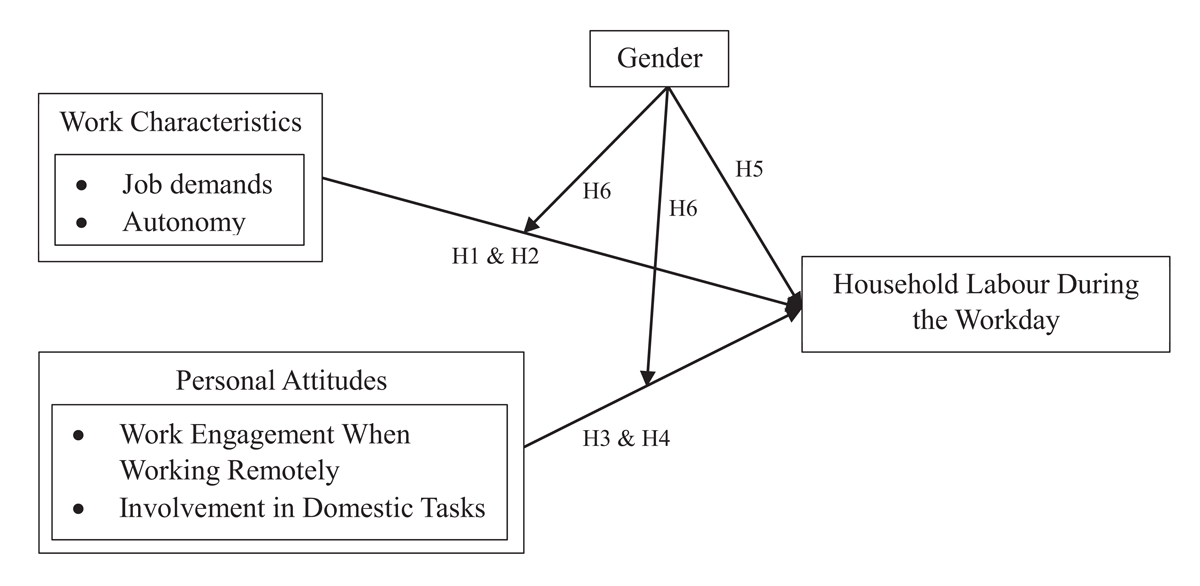
Figure 1
Hypothesized Relationships.
Table 1
Sample Description.
| % | n | |
|---|---|---|
| HLW (ref = no) | 18.9 | 248 |
| Gender | ||
| Women | 65.78 | 861 |
| Men | 34.22 | 448 |
| Education degree | ||
| Lower secondary | 0.90 | 11 |
| Upper secondary | 8.49 | 104 |
| Bachelor’s | 22.94 | 281 |
| Master’s | 56.16 | 688 |
| Doctoral | 9.80 | 120 |
| NA | 1.71 | 21 |
| Living area | ||
| Brussels Capital Region | 46.55 | 608 |
| Outside of Brussels | 53.45 | 698 |
| Organization size | ||
| Small (<50 workers) | 10.54 | 138 |
| Medium (50 to 250 workers) | 12.61 | 165 |
| Large (>250 workers) | 76.85 | 1006 |
[i] Note. N = 1309.
Table 2
Means, Standard Deviations and Correlation Matrix.
| M | SD | MIN | MAX | CORRELATION MATRIX | |||||||
|---|---|---|---|---|---|---|---|---|---|---|---|
| 1. | 2. | 3. | 4. | 5. | 6. | 7. | |||||
| 1. Job demands | 2.67 | 0.71 | 1 | 4 | (0.85) | ||||||
| 2. Autonomy | 3.37 | 0.61 | 1 | 4 | 0.16** | (0.71) | |||||
| 3. Work engagement | 4.93 | 1.20 | 1 | 7 | 0.21** | 0.24** | (0.86) | ||||
| 4. Remote work frequency | 2.53 | 1.06 | 1 | 5 | –0.05 | 0.03 | 0.07* | — | |||
| 5. IDT | 7.42 | 2.01 | 1 | 10 | –0.00 | –0.00 | 0.03 | –0.06* | — | ||
| 6. Gender | — | — | — | — | 0.04 | –0.06*a | 0.10**a | –0.06a | 0.25**a | — | |
| 7. HLW | — | — | — | — | 0.17**a | –0.16**a | 0.12**a | –0.06a | –0.15**a | 0.05b | — |
| Control Variables | |||||||||||
| Age | 42.12 | 10.79 | 18 | 70 | 0.15** | .08** | 0.17** | 0.04 | 0.12** | –0.04a | 0.29**a |
| Cohabitants | 2.89 | 1.32 | 1 | 10 | 0.04 | 0.06* | 0.05 | –0.01 | –0.20** | –0.04a | –0.07*a |
[i] Note. McDonald’s ω of the composite scores are presented in the diagonal of the correlation matrix. Gender was coded as 0 = men, 1 = women; Flexibility use was coded as 0 = no, 1 = yes. IDT = Involvement in Domestic Tasks. HLW = Household Labour during the Workday.
aPoint-biserial correlation.
bTetrachoric correlation.
*p < 0.05. **p < 0.01.
Table 3
Invariance Tests.
| MODEL | χ2 | DF | P | CFI | ΔCFI | RMSEA | ΔRMSEA |
|---|---|---|---|---|---|---|---|
| Configural | 249.414 | 80 | <0.001 | 0.966 | 0.058 | ||
| Metric | 262.278 | 89 | <0.001 | 0.965 | 0.000 | 0.055 | 0.003 |
| Scalar | 288.718 | 97 | <0.001 | 0.962 | 0.003 | 0.055 | –0.000 |
| Strict | 302.577 | 108 | <0.001 | 0.959 | 0.003 | 0.055 | 0.000 |
Table 4
Results of the Multivariable Fractional Polynomials Procedure.
| INVOLVEMENT IN DOMESTIC TASKS | df | DEVIANCE | Δ DEVIANCEa | p | POWERS |
|---|---|---|---|---|---|
| FP2 | 4 | 1138.9 | — | — | 2, 3 |
| FP1 | 2 | 1147.5 | 8.6 | <.05 | –0.5 |
| Linear | 1 | 1156.9 | 18.0 | <.001 | 1 |
[i] Note. FP2 = two-term fractional polynomial. FP1 = one-term fractional polynomial.
aFollows a χ(df)2 distribution.
Table 5
Interaction Tests Between Gender and Job Demands (Model 2), Autonomy (Model 3), Work Engagement (Model 4), and IDT (Model 5) On HLW.
| MODEL 1 | MODEL 2 | MODEL 3 | MODEL 4 | MODEL 5 | ||||||||||||||||
|---|---|---|---|---|---|---|---|---|---|---|---|---|---|---|---|---|---|---|---|---|
| B | SE | WALD | P | B | SE | WALD | P | B | SE | WALD | P | B | SE | WALD | P | B | SE | WALD | P | |
| Intercept | –3.81 | 0.494 | –7.72 | <0.001 | –3.81 | 0.496 | –7.69 | <0.001 | –3.83 | 0.497 | –7.71 | <0.01 | –3.79 | 0.498 | –7.61 | <0.001 | –3.68 | 0.508 | –7.25 | <0.001 |
| Focal variables | ||||||||||||||||||||
| Job demands | 0.332 | 0.081 | 4.09 | <0.001 | 0.321 | 0.156 | 2.038 | <0.05 | 0.333 | 0.081 | 4.09 | <0.001 | 0.333 | 0.082 | 4.08 | <0.001 | 0.333 | 0.081 | 4.11 | <0.001 |
| Autonomy | –0.371 | 0.078 | –4.78 | <0.001 | –0.371 | 0.078 | –4.77 | <0.001 | –0.555 | 0.139 | –3.99 | <0.001 | –0.371 | 0.078 | –4.75 | <0.001 | –0.367 | 0.078 | –4.71 | <0.001 |
| Work engagement | 0.192 | 0.089 | 2.17 | <0.05 | –0.192 | 0.089 | 2.16 | <0.05 | 0.200 | 0.089 | 2.24 | <0.05 | 0.019 | 0.134 | 0.14 | >0.05 | 0.193 | 0.089 | 2.18 | <0.05 |
| Gender | 0.175 | 0.173 | 1.01 | >0.05 | 0.172 | 0.177 | 0.97 | >0.05 | 0.192 | 0.174 | 1.10 | >0.05 | 0.160 | 0.175 | 0.91 | >0.05 | –0.106 | 0.247 | –0.43 | >0.05 |
| IDT2 | –0.112 | 0.022 | –5.17 | <0.001 | –0.112 | 0.022 | –5.16 | <0.001 | –0.114 | 0.022 | –5.26 | <0.001 | –0.113 | 0.022 | –5.21 | <0.001 | — | — | — | — |
| IDT3 | 0.009 | 0.002 | 4.62 | <0.001 | 0.009 | 0.002 | 4.61 | <0.001 | 0.009 | 0.002 | 4.70 | <0.001 | 0.009 | 0.002 | 4.66 | <0.001 | — | — | — | — |
| Gender × Job demands (M2) | — | — | — | — | 0.017 | 0.178 | 0.09 | >0.05 | — | — | — | — | — | — | — | — | — | — | — | — |
| Gender × Autonomy (M3) | — | — | — | — | — | — | — | — | 0.258 | 0.159 | 1.62 | >0.05 | 0.276 | 0.159 | 1.73 | >0.05† | — | — | — | — |
| Gender × Work engagement (M4) | — | — | — | — | — | — | — | — | — | — | — | — | — | — | — | — | — | — | — | — |
| Gender × IDT (M5) | ||||||||||||||||||||
| IDT2 (if Gender = Men) | — | — | — | — | — | — | — | — | — | — | — | — | — | — | — | — | –0.067 | 0.038 | –1.76 | >0.05† |
| IDT3 (if Gender = Men) | — | — | — | — | — | — | — | — | — | — | — | — | — | — | — | — | 0.005 | 0.004 | 1.44 | >0.05 |
| IDT2 (if Gender = Women) | — | — | — | — | — | — | — | — | — | — | — | — | –0.138 | 0.027 | –5.10 | <0.001 | ||||
| IDT3 (if Gender = Women) | — | — | — | — | — | — | — | — | — | — | — | — | 0.011 | 0.002 | 4.68 | <0.001 | ||||
| Control Variables | ||||||||||||||||||||
| Remote work frequency | –0.141 | 0.075 | –1.87 | >0.05† | –0.141 | 0.076 | –1.87 | >0.05† | –0.143 | 0.076 | –1.88 | >0.05† | –0.147 | 0.076 | –1.94 | >0.05† | –0.132 | 0.075 | –1.76 | >0.05† |
| Age | 0.053 | 0.008 | 6.87 | <0.001 | 0.053 | 0.008 | 6.86 | <0.001 | 0.054 | 0.008 | 6.86 | <0.001 | 0.053 | 0.008 | 6.82 | <0.001 | 0.054 | 0.008 | 6.87 | <0.001 |
| Cohabitants | –0.068 | 0.068 | –1.00 | >0.05 | –0.068 | 0.068 | –1.00 | >0.05 | –0.069 | 0.068 | –1.01 | >0.05 | –0.071 | 0.069 | –1.04 | >0.05 | –0.064 | 0.069 | –0.93 | >0.05 |
| Log Likelihood | –563.8 | –563.8 | –562.4 | –562.2 | –562.4 | |||||||||||||||
| LRT a | 0 (1) | 2.7† (1) | 3.0† (1) | 2.7 (2) | ||||||||||||||||
| BIC | 1199.3 | 1206.5 | 1203.8 | 1203.4 | 1210.9 | |||||||||||||||
| McFadden’s R2 | 0.113 | 0.113 | 0.115 | 0.115 | 0.115 | |||||||||||||||
[i] Note. IDT = Involvement in Domestic Tasks. LRT = likelihood ratio test. IDT2, IDT3 are the two-terms transformation (square and cubic) of the Involvement in Domestic Tasks variable, resulting from the multivariable fractional polynomials procedure. Gender is coded as 0 = Men, 1 = Women.
afollows a χ2 distribution.
†p < 0.10.
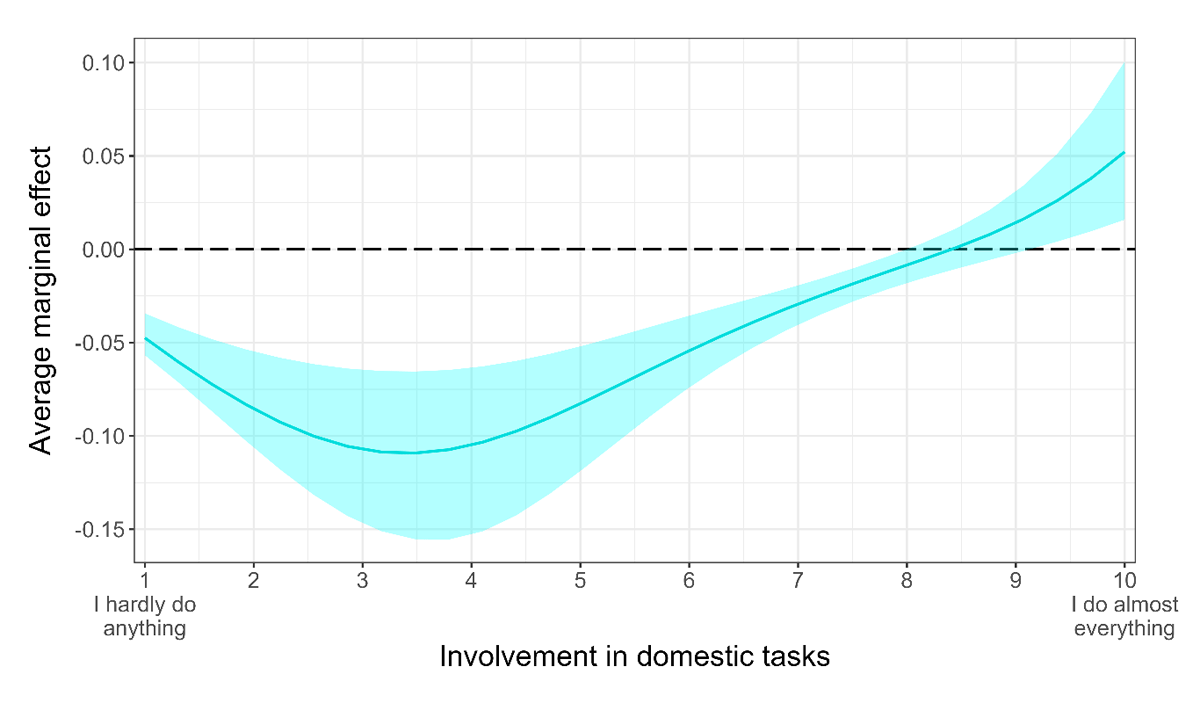
Figure 2
Average Marginal Effects and 95%CIs of IDT on HLW, Conditional on the Values of IDT.