
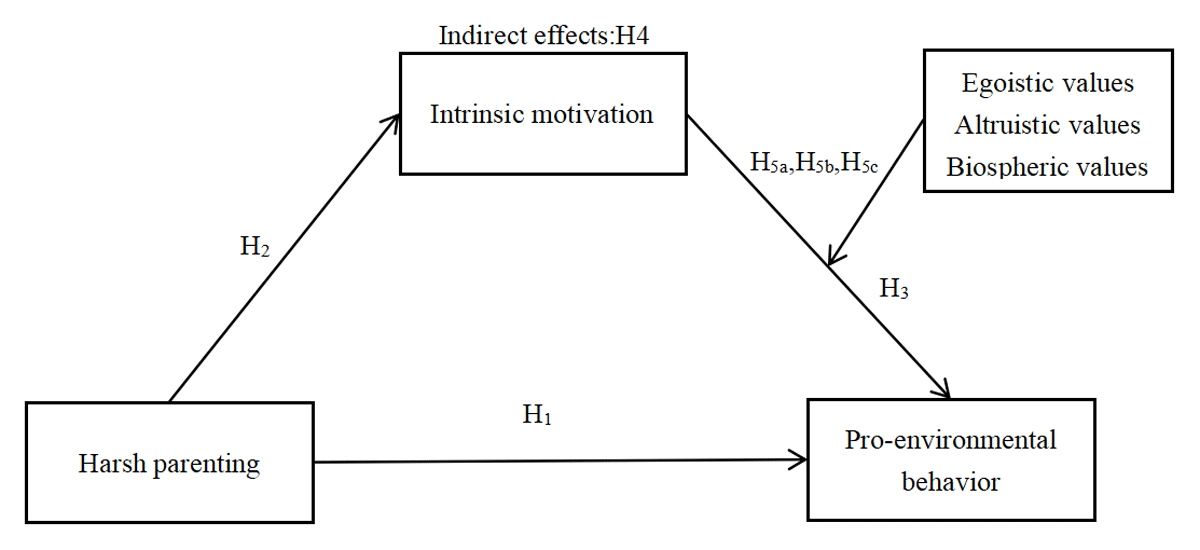
Figure 1
A moderated mediation model of the relationship between harsh parenting and adolescents’ pro-environmental behavior.
Table 1
Characteristics of the sample (n = 602).
| VARIABLES | CATEGORIES | FREQUENCY | PERCENTAGE (%) |
|---|---|---|---|
| Gender | Boy | 242 | 40.2 |
| Girl | 360 | 59.8 | |
| Grade | Senior one | 387 | 64.3 |
| Senior two | 215 | 35.7 | |
| Father’s education | Primary school and below | 47 | 7.8 |
| Junior high school | 231 | 38.4 | |
| Technical secondary school/high school | 176 | 29.2 | |
| College/University and above | 148 | 24.6 | |
| Mother’s education | Primary school and below | 83 | 13.8 |
| Junior high school | 243 | 40.4 | |
| Technical secondary school/high school | 162 | 26.9 | |
| College/University and above | 114 | 18.9 | |
| Monthly household income | <3000 | 67 | 11.1 |
| 3001–5000 | 173 | 28.7 | |
| 5001–7000 | 166 | 27.6 | |
| 7001–9000 | 91 | 15.1 | |
| >9001 | 105 | 17.4 | |
| Harsh parenting | Never (The mean is equal to 1) | 91 | 15.1 |
| Mild (The mean is greater than 1 and less than or equal to 2) | 326 | 54.1 | |
| Moderate (The mean is greater than 2 and less than or equal to 4) | 173 | 28.7 | |
| Severe (The mean is greater than 4) | 12 | 2.0 | |
| Intrinsic motivation | Low (The mean is less than or equal to 4) | 29 | 4.8 |
| Moderate (The mean is greater than 4 and less than or equal to 6) | 252 | 41.9 | |
| High (The mean is greater than 6) | 321 | 53.3 |
Table 2
Means, Standard Deviations and Correlations for the Variables.
| M | SD | 1 | 2 | 3 | 4 | 5 | 6 | 7 | 8 | 9 | 10 | 11 | 12 | |
|---|---|---|---|---|---|---|---|---|---|---|---|---|---|---|
| 1. Harsh parenting | 1.923 | .814 | 1 | |||||||||||
| 2. Intrinsic motivation | 6.104 | .911 | –.114** | 1 | ||||||||||
| 3. Egoistic values | 3.462 | .741 | .090* | .078 | 1 | |||||||||
| 4. Altruistic values | 4.429 | .600 | –.128** | .308** | .233** | 1 | ||||||||
| 5. Biospheric values | 4.552 | .597 | –.153** | .284** | .157** | .839** | 1 | |||||||
| 6. Pro-environmental behavior | 3.800 | .721 | –.094* | .456** | .227** | .503** | .496** | 1 | ||||||
| 7. Age | 16.250 | .687 | .045 | –.198** | .019 | –.055 | –.058 | –.071 | 1 | |||||
| 8. Grade | .074 | –.110** | .037 | –.135** | –.122** | –.085* | .670** | 1 | ||||||
| 9. Gender | –.043 | .102* | –.098* | .079 | .069 | .010 | –.019 | .024 | 1 | |||||
| 10. Father’s education | –.016 | .135** | .041 | .090* | .108** | .190** | –.179** | –.246** | –.048 | 1 | ||||
| 11. Mother’s education | –.035 | .112** | .048 | .142** | .148** | .247** | –.179** | –.255** | –.058 | .674** | 1 | |||
| 12. Household income | –.060 | .066 | –.009 | .070 | .098* | .061 | –.078 | –.099* | –.155** | .369** | .357** | 1 |
[i] Note: N = 602; *p < 0.05; **p < 0.01; ***p < 0.001; SD = Standard deviation.
Table 3
The total, direct and indirect pathways between harsh parenting and pro-environmental behavior.
| EFFECT SOURCE | β | SE | 95%CI | T | P | RELATIVE EFFECT VALUE |
|---|---|---|---|---|---|---|
| Total Effect | –0.076 | 0.035 | [–0.146, –0.007] | –2.170 | 0.030 | |
| Direct Effect | –0.036 | 0.032 | [–0.099, 0.026] | –1.145 | 0.253 | |
| HP→PEB | ||||||
| Indirect Effect | –0.040 | 0.018 | [–0.077, –0.007] | 52.632% | ||
| HP→IM→PEB | ||||||
[i] Note: HP = Harsh Parenting; IM = Intrinsic Motivation; PEB = Pro-Environmental Behavior.
Table 4
Test of the Moderating Effect of Values between Harsh Parenting and Pro-environmental Behavior.
| VARIABLE | PRO-ENVIRONMENTAL BEHAVIOR | |||||||||||
|---|---|---|---|---|---|---|---|---|---|---|---|---|
| β | SE | T | 95% CI | β | SE | T | 95% CI | β | SE | T | 95% CI | |
| Covariate | ||||||||||||
| Age | 0.072 | 0.050 | 1.463 | [–0.025, 0.169] | 0.021 | 0.046 | 0.455 | [–0.070, 0.111] | 0.034 | 0.046 | 0.740 | [–0.057, 0.125] |
| Grade | –0.050 | 0.072 | –0.700 | [–0.191, 0.090] | 0.051 | 0.067 | 0.759 | [–0.081, 0.182] | 0.030 | 0.067 | 0.455 | [–0.101, 0.162] |
| Gender | –0.016 | 0.052 | –0.316 | [–0.118, 0.086] | –0.064 | 0.048 | –1.324 | [–0.158, 0.031] | –0.069 | 0.048 | –1.433 | [–0.164, 0.026] |
| Father’s education | 0.004 | 0.036 | 0.107 | [–0.068, 0.075] | 0.028 | 0.034 | 0.823 | [–0.039, 0.094] | 0.019 | 0.034 | 0.565 | [–0.047, 0.086] |
| Mother’s education | 0.149 | 0.036 | 4.167*** | [0.079, 0.219] | 0.116 | 0.033 | 3.473*** | [0.050, 0.181] | 0.124 | 0.033 | 3.706*** | [0.058, 0.189] |
| Family monthly income | –0.020 | 0.022 | –0.931 | [–0.063, 0.023] | –0.032 | 0.020 | –1.570 | [–0.071, 0.008] | –0.041 | 0.020 | –2.015 | [–0.081, –0.001] |
| Independent Variable | ||||||||||||
| HP | –0.059 | 0.031 | –1.884 | [–0.120, 0.003] | –0.008 | 0.029 | –0.266 | [–0.064, 0.049] | 0.001 | 0.029 | 0.045 | [–0.056, 0.057] |
| IM | 0.342 | 0.029 | 12.005*** | [0.286, 0.398] | 0.280 | 0.028 | 10.045*** | [0.225, 0.335] | 0.284 | 0.028 | 10.243*** | [0.229, 0.338] |
| Moderator | ||||||||||||
| EV | 0.213 | 0.036 | 6.002*** | [0.143, 0.282] | ||||||||
| AV | 0.467 | 0.041 | 11.331*** | [0.386, 0.548] | ||||||||
| BV | 0.468 | 0.041 | 11.314*** | [0.386, 0.549] | ||||||||
| Interaction | ||||||||||||
| IM × EV | –0.127 | 0.042 | –3.062*** | [–0.209, –0.046] | ||||||||
| IM × AV | 0.156 | 0.042 | 3.706*** | [0.073,0.239] | ||||||||
| IM × BV | 0.115 | 0.043 | 2.656** | [0.030, 0.200] | ||||||||
| R2 | 0.299 | 0.398 | 0.392 | |||||||||
| F | 25.231*** | 39.107*** | 38.132*** | |||||||||
[i] Note: HP = Harsh Parenting; IM = Intrinsic Motivation; EV = Egoistic Values; AV = Altruistic Values; BV = Biospheric Values.* p < 0.05; ** p < 0.01; *** p < 0.001.
Table 5
Test of conditional indirect effects.
| EGOISTIC VALUES | PRO-ENVIRONMENTAL BEHAVIOR | ||
|---|---|---|---|
| β | SE | 95%CI | |
| Low-level EV (–1SD) | –0.050 | 0.024 | [–0.100, –0.009] |
| High-level EV (+1SD) | –0.028 | 0.013 | [–0.058, –0.005] |
| Indirect effect difference | 0.022 | 0.014 | [0.001, 0.056] |
[i] Note: Dependent Variable = Pro-environmental Behavior; EV = Egoistic Values.
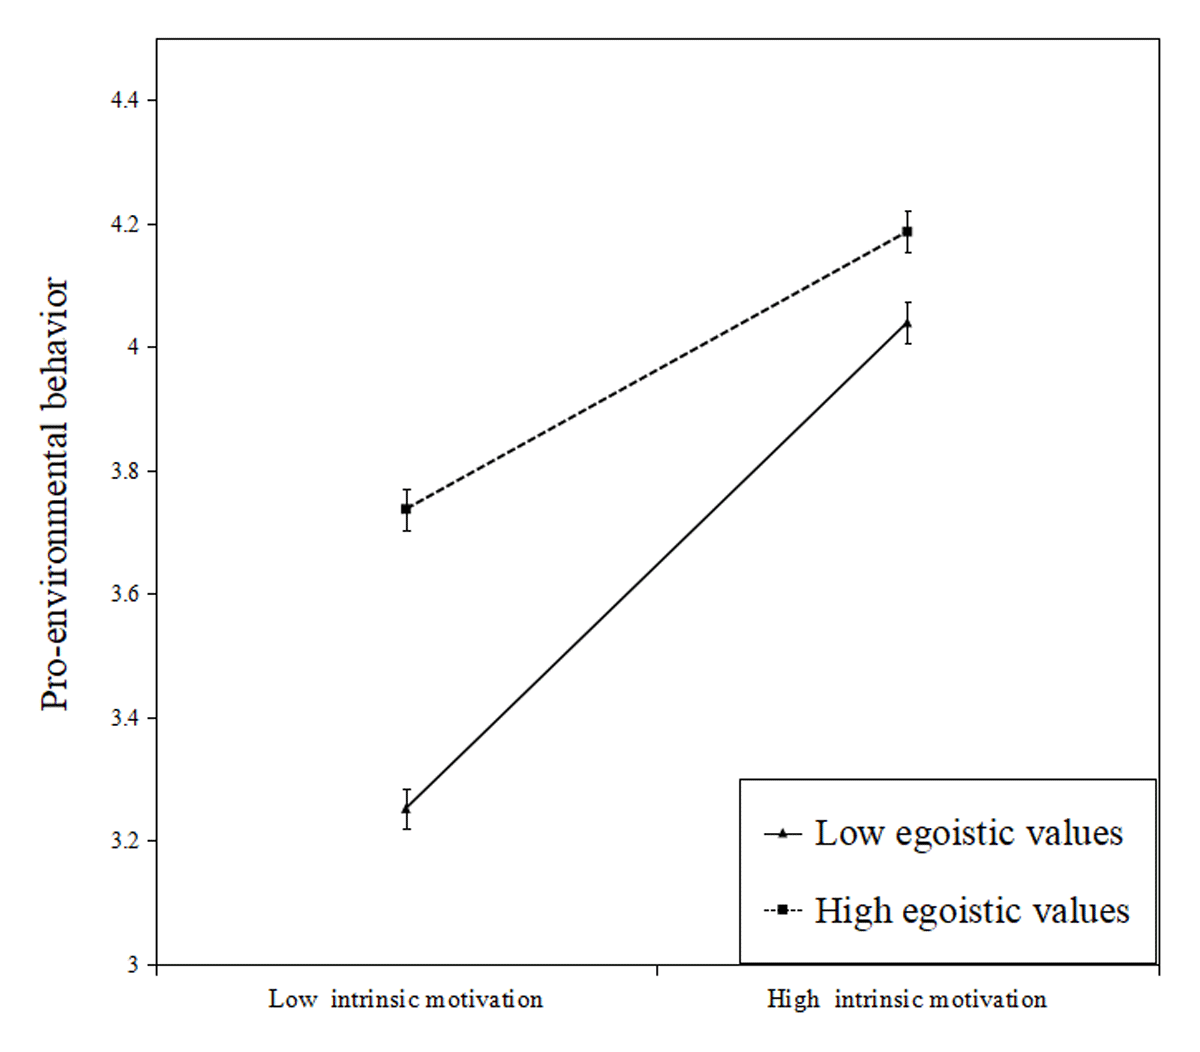
Figure 2a
Moderating effect of egoistic values on the relationship between intrinsic motivation and pro-environmental behavior. (Error bars represent standard error.)
Table 6
Test of conditional indirect effects.
| ALTRUISTIC VALUES | PRO-ENVIRONMENTAL BEHAVIOR | ||
|---|---|---|---|
| β | SE | 95%CI | |
| Low-level AV (–1SD) | –0.021 | 0.011 | [–0.046, –0.003] |
| High-level AV (+1SD) | –0.042 | 0.019 | [–0.081, –0.007] |
| Indirect effect difference | –0.021 | 0.012 | [–0.047, –0.002] |
[i] Note: Dependent Variable = Pro-environmental Behavior; AV = Altruistic Values.
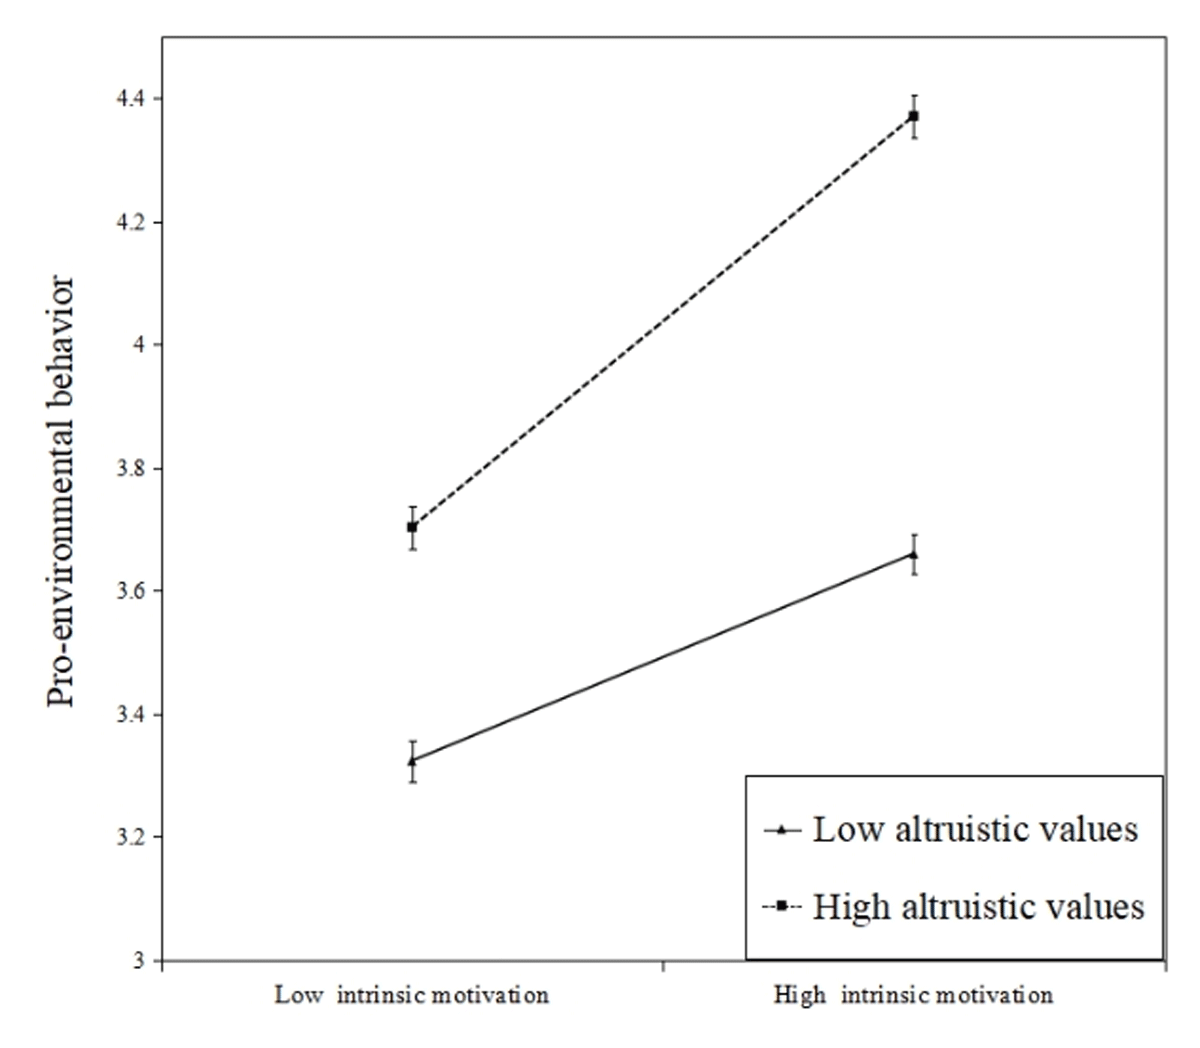
Figure 2b
Moderating effect of altruistic values on the relationship between intrinsic motivation and pro-environmental behavior. Error bars represent standard error.
Table 7
Test of conditional indirect effects.
| BIOSPHERIC VALUES | PRO-ENVIRONMENTAL BEHAVIOR | ||
|---|---|---|---|
| β | SE | 95%CI | |
| Low-level BV (–1SD) | –0.025 | 0.011 | [–0.048, –0.005] |
| High-level BV (+1SD) | –0.038 | 0.018 | [–0.076, –0.007] |
| Indirect effect difference | –0.014 | 0.010 | [–0.037, –0.0003] |
[i] Note: Dependent Variable = Pro-environmental Behavior; BV = Biospheric Values.
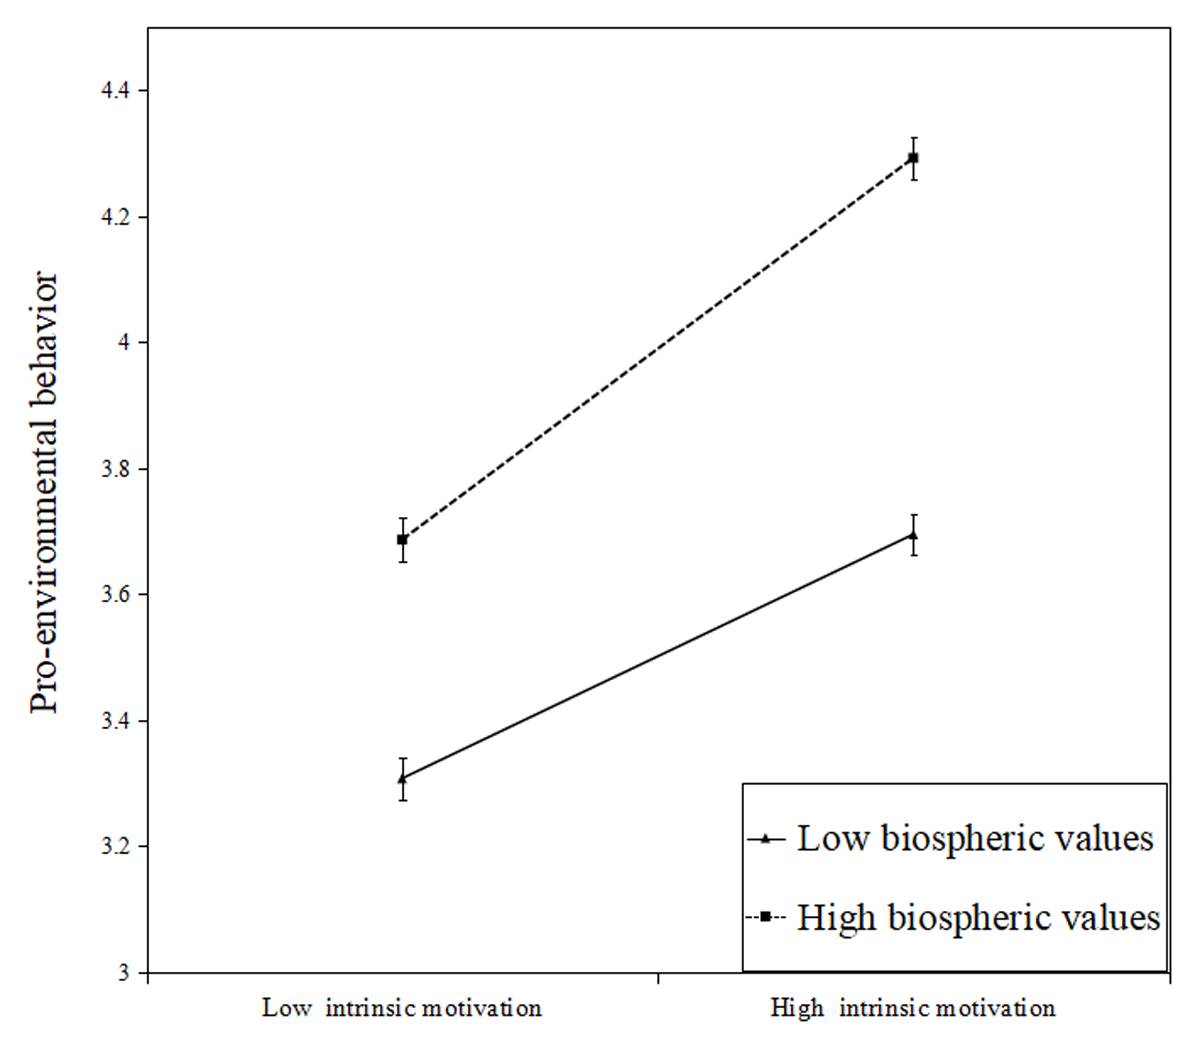
Figure 2c
Moderating effect of biospheric values on the relationship between intrinsic motivation and pro-environmental behavior. Error bars represent standard error.