
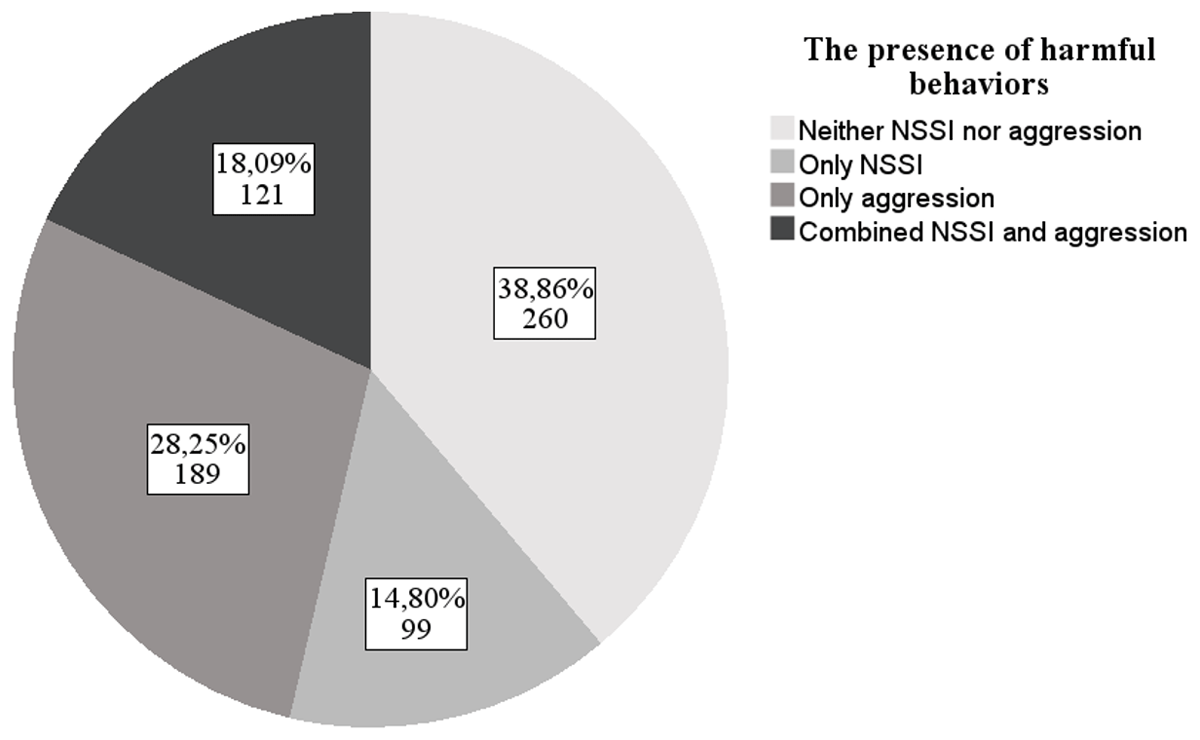
Figure 1
Participants grouped according to reported harmful behaviors.
Note. NSSI = Non-suicidal self-injury. The pie chart displays the number of participants and percentages.
Table 1
Multivariate logistic regression analyses examining reported harmful behaviors.
| COMPARISON 1: NO-HARM (n = 260) VERSUS NSSI-ONLY (n = 99; REFERENT) | COMPARISON 2: NO-HARM (n = 260) VERSUS AGGRESSION-ONLY (n = 189; REFERENT) | COMPARISON 3: NO-HARM (n = 260) VERSUS DUAL-HARM (n = 121; REFERENT) | COMPARISON 4: NSSI-ONLY (n = 99) VERSUS AGGRESSION-ONLY (n = 189; REFERENT) | COMPARISON 5: NSSI-ONLY (n = 99) VERSUS DUAL-HARM (n = 121; REFERENT) | COMPARISON 6: AGGRESSION-ONLY (n = 189) VERSUS DUAL-HARM (n = 121; REFERENT) | |
|---|---|---|---|---|---|---|
| OR (95% CI) | OR (95% CI) | OR (95% CI) | OR (95% CI) | OR (95% CI) | OR (95% CI) | |
| Age | 0.95 (0.85–1.07) | 0.92 (0.84–1.01) | 0.81 (0.81–1.03) | 1.00 (0.88–1.13) | 1.06 (0.92–1.22) | 0.99 (0.88–1.11) |
| Identifying as man | 0.34 (0.17–0.67)** | 0.94 (0.59–1.51) | 0.65 (0.35–1.20) | 2.36 (1.15–4.84)* | 1.61 (0.69–3.61) | 0.77 (0.42–1.42) |
| Flight-freeze system | 0.73 (0.54–0.99)* | 0.96 (0.76–1.22) | 0.62 (0.46–0.85)** | 1.26 (0.93–1.71) | 0.96 (0.68–1.35) | 0.76 (0.57–1.01) |
| Behavioral inhibition system (BIS) | 1.82 (1.33–2.50)*** | 0.78 (0.61–1.00)* | 1.70 (1.23–2.36)*** | 0.42 (0.29–0.59)*** | 0.88 (0.60–1.29) | 1.90 (1.38–2.61)*** |
| Behavioral activation system (BAS) | ||||||
| Reward interest (RI) | 0.94 (0.66–1.35) | 0.68 (0.51–0.90)* | 0.60 (0.43–0.85)** | 0.71 (0.49–1.02) | 0.61 (0.42–0.89)** | 0.90 (0.65–1.24) |
| Goal-drive persistence (GDP) | 0.71 (0.52–0.97)* | 0.93 (0.73–1.19) | 1.18 (0.87–1.59) | 1.39 (0.99–1.94) | 1.65 (1.16–2.35)** | 1.22 (0.90–1.66) |
| Reward reactivity (RR) | 0.67 (0.49–0.91)* | 0.91 (0.71–1.17) | 0.73 (0.53–1.01) | 1.17 (0.86–1.59) | 0.88 (0.63–1.25) | 0.81 (0.60–1.10) |
| Impulsivity (IMP) | 1.37 (0.96–1.96) | 2.40 (1.81–3.19)*** | 2.15 (1.53–3.02)*** | 1.95 (1.35–2.82)*** | 1.79 (1.22–2.62)** | 0.93 (0.67–1.28) |
| Effortful control (EC) | 1.14 (0.81–1.59) | 0.98 (0.74–1.29) | 0.61 (0.43–0.87)** | 0.76 (0.53–1.09) | 0.49 (0.33–0.73)*** | 0.64 (0.45–0.91)* |
| Nagelkerke R2 | 0.207 | 0.162 | 0.374 | 0.258 | 0.243 | 0.214 |
[i] Note. *p < .05. **p < .01. ***p < .001. Odds ratios significant after applying the Bonferroni correction are boldfaced. OR = Odds Ratio. CI = Confidence Interval. NSSI = non-suicidal self-injury.