
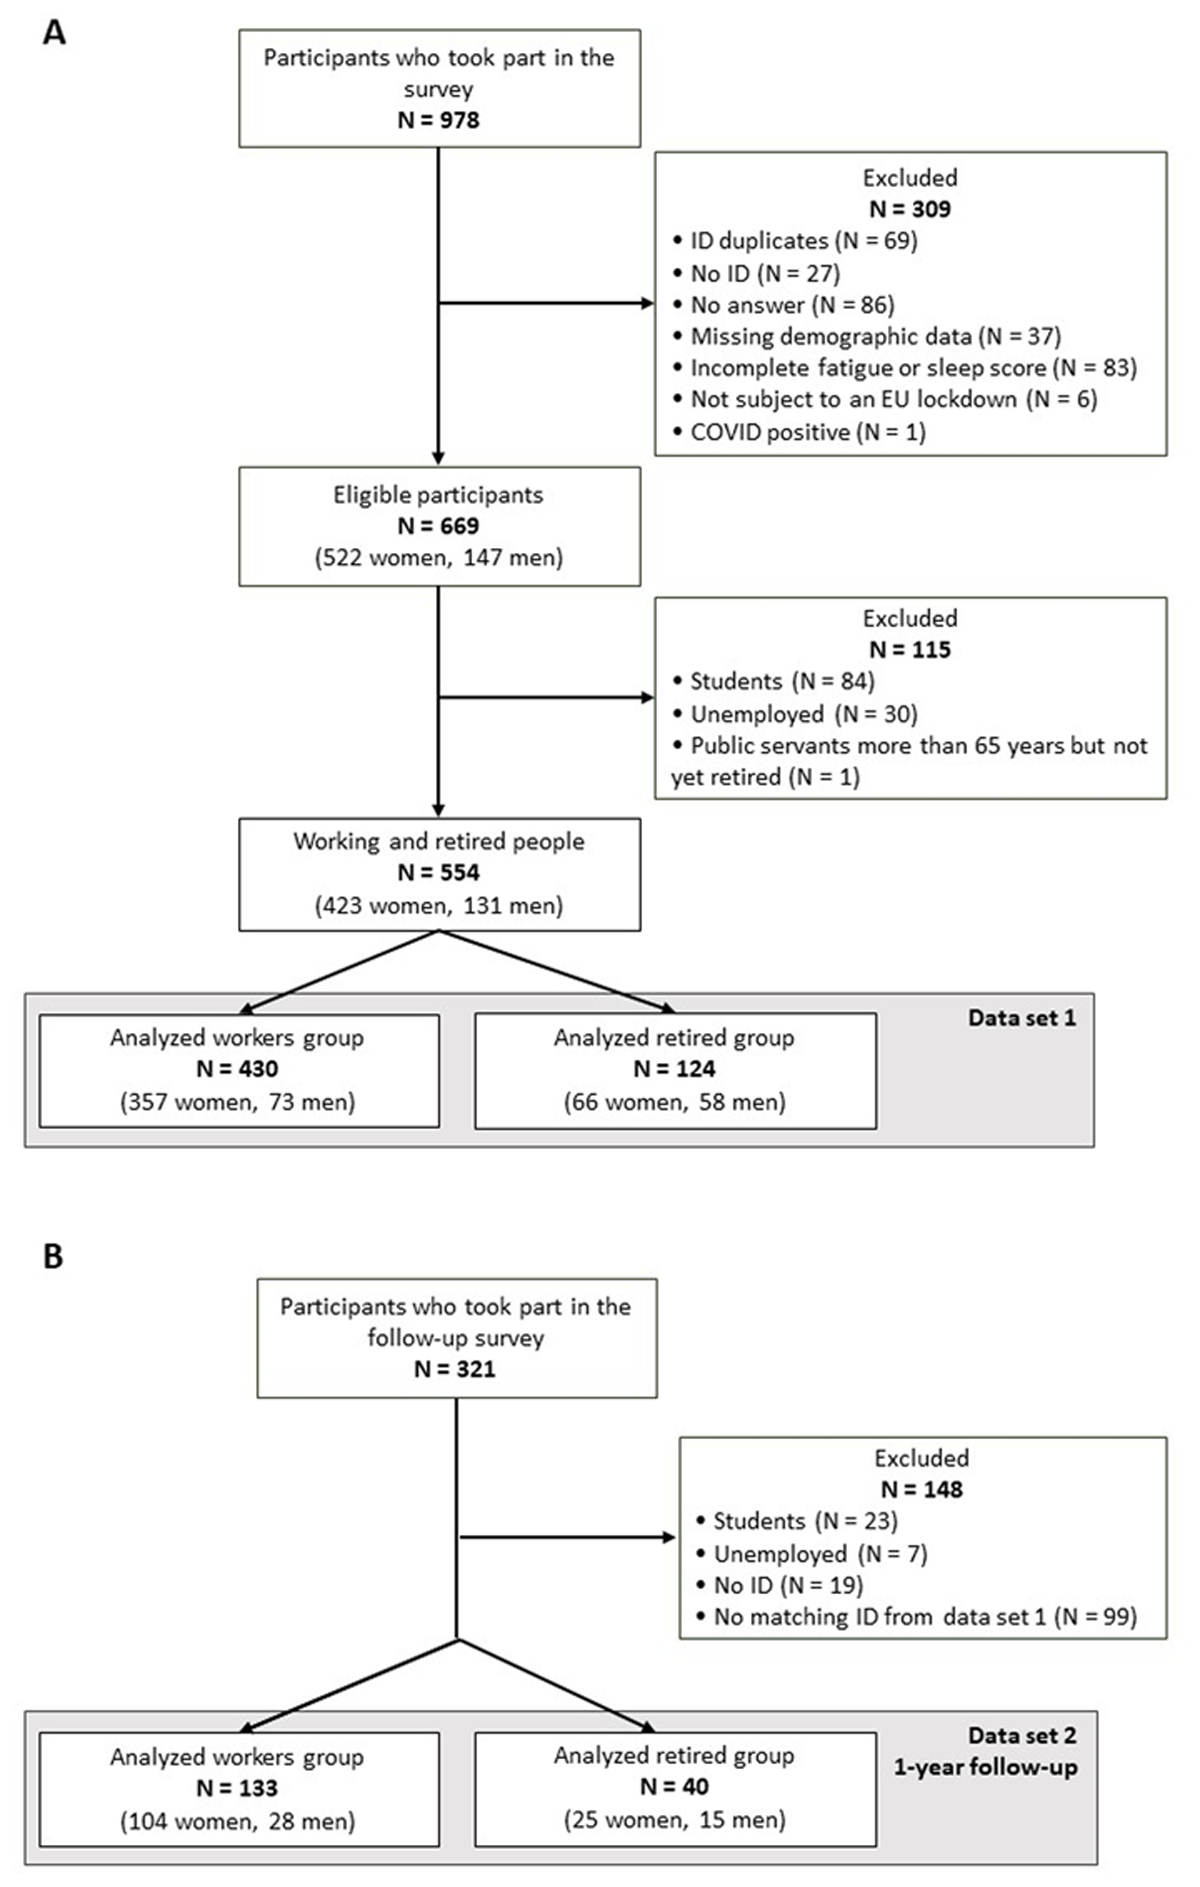
Figure 1
Flowchart of Participants for (a) data set 1 and (b) data set 2.
Table 1
Demographic information for workers (a) and retirees (b): Data set 1.
| GROUP CHARACTERISTICS | MODALITIES | N (%) |
|---|---|---|
| (a) Workers (N = 430) | ||
| Age, years | 40.43 (SD = 12.16) (range 20–69 years) | |
| Gender | Male | 73 (16.98) |
| Female | 357 (83.02) | |
| Educational level | Elementary school | 1 (0.24) |
| High school | 24 (5.9) | |
| Undergraduate degree (shortype) | 105 (24.88) | |
| Postgraduate degree (longtype) | 292 (69.19) | |
| Teleworking, yes | 316 (73.49) | |
| (b) Retirees (N = 124) | ||
| Age, years | 68.86 (SD = 6.13) (range 52–87 years) | |
| Gender | Male | 58 (46.77) |
| Female | 66 (53.23) | |
| Educational level | Elementary school | 3 (2.42) |
| High school | 26 (20.97) | |
| Undergraduate degree (shortype) | 48 (38.71) | |
| Postgraduate degree (longtype) | 44 (35.48) | |
Table 2
Demographic information for workers (a) and retirees (b): Data set 2.
| GROUP CHARACTERISTICS | MODALITIES | N (%) |
|---|---|---|
| (a) Workers (N = 133) | ||
| Age, years | 44.32 (SD = 11.23) (range 24–67 years) | |
| Gender | Male | 28 (21.05) |
| Female | 104 (78.20) | |
| Educational level | Elementary school | 0 |
| High school | 6 (4.55) | |
| Undergraduate degree (short) | 34 (25.76) | |
| Postgraduate degree (long) | 92 (69.17) | |
| Teleworking, yes | 87 (65.41) | |
| (b) Retirees (N = 40) | ||
| Age, years | 68.20 (SD = 5.64) (range 56–83 years) | |
| Gender | Male | 25 (62.50) |
| Female | 15 (37.50) | |
| Educational level | Elementary school | 2 (5.00) |
| High school | 6 (15.00) | |
| Undergraduate degree (short) | 18 (45.00) | |
| Postgraduate degree (long) | 14 (35.00) | |
Table 3
Variables used in statistical analyses for data sets 1 and 2.
| CATEGORIES | VARIABLES | INSTRUMENTS |
|---|---|---|
| Demographics | Age | – |
| Gender | – | |
| Education | – | |
| Working status1 | – | |
| Anxiety state | General anxiety | State–Trait Anxiety Inventory (STAI)2 |
| COVID–related anxiety | Visual analog scale (0 to 100) | |
| Work–related activities | Home office | Yes/No question |
| Effort | Visual analog scale (0 to 100) | |
| Flexibility | Visual analog scale (0 to 100) | |
| Work activity | Visual analog scale (0 to 100) | |
| Leisure–related activities | Screen exposure | Estimated daily duration (in minutes) |
| Outdoor | Estimated daily duration (in minutes) | |
| Sport | Estimated daily duration (in minutes) | |
| Mental load | House duties | Visual analog scale (0 to 100) |
| Social interactions | Visual analog scale (0 to 100) | |
| Work/volunteering | Visual analog scale (0 to 100) | |
| Self–centered leisure activities | Visual analog scale (0 to 100) | |
| Sleep and sleepiness | Sleepiness | Epworth Sleepiness Scale (ESS)3 |
| Sleep quality | Pittsburgh Sleep Quality Index (PSQI)4 | |
| Naps | Calculation based on naps quantity and duration5 | |
| Fatigue | Physical | Multidimensional Fatigue Inventory (MFI)6 |
| Mental | Multidimensional Fatigue Inventory (MFI)6 |
[i] Note. In italic, workers only. 1Working status was used to include workers and retirees in separate analyses. 2Anxiety level was measured by the 6-item short form of the STAI (Spielberger, 1983; Marteau & Bekker, 1992); 3Measured by ESS (Johns, 1991); 4Sleep related scores were extracted from PSQI (Buysse et al., 1989); 5Nap Score calculation based on quantity and duration (see Appendix B for detailed presentation); 6Fatigue was measured by MFI (Smets et al., 1995), which provides separate scores for physical and mental fatigue.
Table 4
Raw values and statistical outcomes of the paired sample t-tests/Wilcoxon tests (depending on the normality) for workers.
| BEFORE LOCKDOWN (INITIAL SAMPLE, N = 430) | DURING LOCKDOWN (INITIAL SAMPLE, N = 430) | BEFORE VS DURING (INITIAL SAMPLE, N = 430) | DURING LOCKDOWN (FOLLOW-UP SAMPLE, N = 133) | 1Y POST LOCKDOWN (FOLLOW-UP SAMPLE, N = 133) | DURING VS POST (FOLLOW-UP SAMPLE, N = 133) | |
|---|---|---|---|---|---|---|
| MEAN (SD) MIN-MAX | MEAN (SD)MIN-MAX | MEAN (SD) MIN-MAX | MEAN (SD) MIN-MAX | |||
| FATIGUE | ||||||
| Physical fatigue | 9.68 (3.51) 4.00–20.00 | 10.72 (3.76) 4.00–20.00 | W = 22460.50, p < .001 | 10.02 (3.53) 4.00–20.00 | 11.66 (4.10) 4.00–20.00 | W = 2050.50, p < .001 |
| Mental Fatigue | 9.34 (3.36) 4.00–19.00 | 11.37 (4.13) 4.00–20.00 | W = 15936.00, p < .001 | 10.82 (3.98) 4.00–20.00 | 10.58 (4.11) 4.00–20.00 | t = 0.68, p = .50 |
| ANXIETY STATE | ||||||
| General anxiety | – | 13.07 (4.23) 6.00–24.00 | – | 12.11 (3.80) 6.00–23.00 | 13.50 (2.72) 9.00–20.00 | t = –3.97, p < .001 |
| COVID-related anxiety | – | 58.04 (29.01) 0–100 | – | 55.86 (30.62) 0–100 | 40.42 (29.82) 0–100 | t = 4.83, p < .001 |
| WORK ACTIVITIES | ||||||
| Work from home, yes (%) | – | 73.49 | – | 77.44 | 65.41 | χ2 = 35.31, p < .001 |
| Effort | 62.02 (23.44) 0–100 | 61.90 (31.50) 0–100 | W = 33310.00, p = .15 | 60.83 (32.88) 1–100 | 64.76 (25.87) 2–100 | t = –1.12, p = .27 |
| Flexibility | 51.01 (34.26) 0–100 | 72.27 (32.30) 0–100 | W = 9802.50, p < .001 | 74.98 (32.75) 0–100 | 57.44 (35.74) 0–100 | W = 5016.00, p < .001 |
| Activity | 84.47 (46.90) 0–100 | 58.75 (33.89) 0–100 | W = 55115.00, p < .001 | 60.63 (34.38) 0–100 | 81.89 (23.34) 0–100 | W = 1165.00, p < .001 |
| LEISURE ACTIVITIES | ||||||
| Screen exposure, min-24h | 305.71 (216.14) 1–960 | 357.87 (224.10) 0–960 | W = 13260.50, p < .001 | 377.66 (217.40) 1–960 | 371.25 (229.79) 2–840 | W = 3916.50, p = .919 |
| Outdoor activities, min-24h | 65.16 (65.65) 0–480 | 79.85 (84.32) 0–540 | W = 30817.00, p = .012 | 78.05 (79.66) 0–360 | 50.58 (46.12) 1–300 | W = 4249.00, p = .03 |
| Sports, min-24h | 38.85 (51.81) 0–480 | 37.27 (41.74) 0–360 | W = 24705.50, p = .76 | 39.48 (41.59) 0–210 | 33.91 (51.71) 0–400 | W = 4102.50, p = .08 |
| MENTAL LOAD | ||||||
| House duties | 50.83 (28.21) 0–100 | 63.96 (29.53) 0–100 | W = 24802.00, p < .001 | 68.21 (28.36) 0–100 | 46.96 (29.79) 0–100 | W = 6401.00, p < .001 |
| Social interactions | 75.70 (23.57) 0–100 | 69.24 (28.63) 0–100 | W = 38719.50, p = .001 | 71.36 (29.37) 0–100 | 69.90 (27.61) 0–100 | t = .59, p = .56 |
| At work | 80.21 (19.35) 4–100 | 55.63 (31.71) 0–100 | W = 62791.50, p < .001 | 63.35 (26.24) 0–100 | 61.23 (31.71) 0–100 | t = .53, p = .60 |
| Self-centered activities | 64.66 (30.85) 0–100 | 69.01 (29.04) 0–100 | W = 32198.00, p = .035 | 71.52 (27.76) 2–100 | 63.80 (31.29) 0–100 | t = 2.21, p = .29 |
| SLEEP & SLEEPINESS | ||||||
| Sleepiness (ESS) | 8.31 (4.01) 0–20 | 7.53 (4.38) 0–21 | W = 35712.50, p < .001 | 6.94 (4.27) 0–19 | 8.18 (4.92) 0–22 | t = 2.90, p = .004 |
| Sleep quality PSQI-C1 | 1.15 (0.75) 0–3 | 1.37 (0.88) 0–3 | W = 7193.00, p < .001 | 1.26 (0.90) 0–3 | 0.80 (0.94) 0–3 | W = 3554.00, p < .001 |
| Sleep latency PSQI-C2 | 1.09 (0.86) 0–3 | 1.29 (1.03) 0–3 | W = 7392.00, p < .001 | 1.17 (0.91) 0–3 | 1.21 (0.89) 0–3 | W = 2047.50, p = .71 |
| Sleep duration PSQI-C3 | 0.38 (0.66) 0–3 | 0.34 (0.70) 0–3 | W = 5114.00, p = .22 | 0.35 (0.66) 0–3 | 0.86 (0.85) 0–3 | W = 606.00, p < .001 |
| Sleep efficiency PSQI-C4 | 0.40 (0.74) 0–3 | 0.55 (0.85) 0–3 | W = 4588.50, p < .001 | 0.53 (0.84) 0–3 | 0.70 (0.94) | W = 1138.50, p = .12 |
| Sleep disturbance PSQI-C5 | 1.25 (0.50) 0–3 | 1.31 (0.55) 0–3 | W = 2520.50, p = .022 | 1.32 (0.57) 0–3 | 2.18 (0.52) 0–3 | W = 409.50, p < .001 |
| Sleep pills PSQI-C6 | 0.51 (0.99) 0–3 | 0.54 (1.04) 0–3 | W = 992.00, p = .34 | 0.47 (1.00) 0–3 | 0.53 (1.04) 0–3 | W = 214.00, p = .51 |
| Daytime dysfunction PSQI-C7 | 1.19 (0.95) 0–3 | 1.20 (0.99) 0–3 | W = 10044.50, p = .27 | 1.16 (0.97) 0–3 | 1.03 (0.70) 0–3 | W = 1419.00, p = .07 |
| Naps | 0.77 (1.31) 0–7.25 | 1.17 (1.81) 0–7.75 | W = 4932.50, p < .001 | 1.11 (1.78) 0–7.25 | 0.61 (1.20) 0–6.50 | W = 1377.50, p = .011 |
Table 5
Raw values and statistical outcomes of the paired sample t-tests/Wilcoxon tests (depending on the normality) for retirees.
| BEFORE LOCKDOWN (INITIAL SAMPLE, N = 124) | DURING LOCKDOWN (INITIAL SAMPLE, N = 124) | BEFORE VS DURING (INITIAL SAMPLE, N = 124) | DURING LOCKDOWN (FOLLOW-UP SAMPLE, N = 37) | 1Y POST LOCKDOWN (FOLLOW-UP SAMPLE, N = 37) | DURING VS POST (FOLLOW-UP SAMPLE, N = 37) | |
|---|---|---|---|---|---|---|
| MEAN (SD) MIN-MAX | MEAN (SD) MIN-MAX | MEAN (SD) MIN-MAX | MEAN (SD) MIN-MAX | |||
| FATIGUE | ||||||
| Physical fatigue | 8.70 (2.98) 4–18 | 9.41 (3.46) 4–17 | W = 1247.50, p = .003 | 9.10 (3.23) 4–16 | 11.00 (3.45) 4–19 | t = –4.05, p < .001 |
| Mental Fatigue | 8.61 (2.90) 4–15 | 9.15 (3.34) 4–19 | W = 1619.50, p = .041 | 8.50 (3.20) 4–19 | 9.09 (3.00) 4–15 | t = –1.415, p = .17 |
| ANXIETY STATE | ||||||
| General anxiety | – | 11.44 (3.51) 6– 24 | – | 11.28 (3.35) 7–22 | 12.13 (26.56) 7–20 | W = 157.00, p = .027 |
| COVID-related anxiety | – | 51.65 (29.76) 1–100 | – | 50.28 (26.36) 1–99 | 37.11 (29.00) 3–100 | t = 2.90, p = .006 |
| LEISURE ACTIVITIES | ||||||
| Screen exposure, min-24h | 128.08 (91.15) 0–420 | 173.19 (125.19) 0–660 | W = 57.00, p < .001 | 186.49 (139.75) 5–660 | 144.98 (97.82) 3–378 | t = 1.54, p = .13 |
| Outdoor activities, min-24h | 101.22 (82.66) 1–370 | 94.23 (94.50) 0–420 | W = 2391, p = .17 | 93.11 (79.05) 10–360 | 69.58 (61.12) 0–300 | t = 1.948, p = .059 |
| Sports, min-24h | 64.31 (63.74) 0–360 | 53.86 (64.42) 0–410 | W = 1859.50, p = .002 | 45.87 (45.75) 0–150 | 42.03 (31.79) 0–120 | t = 0.483, p = .63 |
| MENTAL LOAD | ||||||
| House duties | 68.45 (27.26) 5–100 | 71.31 (27.85) 8–100 | W = 2031.00, p = .21 | 72.25 (28.51) 8–100 | 73.16 (20.72) 4–100 | t = –0.35, p = .73 |
| Social interactions | 79.60 (20.83) 20–100 | 71.96 (28.41) 1–100 | W = 3102.00, p < .001 | 71.48 (27.84) 1–100 | 75.03 +–21.36 6–100 | t = –0.77, p = .44 |
| Self-centered activities | 80.69 (19.78) 4–100 | 76.91 (23.58) 2–100 | W = 3071.50, p = .90 | 76.68 (24.10) 2–100 | 77.92 +–22.09 21–100 | t = –0.22, p = .82 |
| SLEEP & SLEEPINESS | ||||||
| Sleepiness (ESS) | 7.29 (4.15) 0–20 | 6.75 (4.05) 0–20 | W = 1604.50, p = .008 | 6.43 (3.62) 0–15 | 7.27 (4.23) 0–19 | t = –2.11, p = .041 |
| Sleep quality PSQI-C1 | 0.93 (0.63) 0–3 | 0.99 (0.70) 0–3 | W = 112.50, p = .13 | 1.10 (0.71) 0–3 | 1.23 (0.66) 0–3 | W = 48.00, p = .26 |
| Sleep latency PSQI- C2 | 0.86 (0.74) 0–3 | 0.89 (0.81) 0–3 | W = 132.00, p = .58 | 0.95 (0.78) 0–3 | 0.95 (0.78) 0–3 | W = 45.50, p = 1.0 |
| Sleep duration PSQI-C3 | 0.29 (0.64) 0–3 | 0.32 (0.69) 0–3 | W = 32.50, p = .34 | 0.33 (0.66) 0–3 | 0.46 (0.68) 0–3 | W = 10.00, p = .11 |
| Sleep efficiency PSQI-C4 | 0.30 (0.58) 0–2 | 0.40 (0.70) 0–3 | W = 77.00, p = .042 | 0.45 (0.71) 0–2 | 0.58 (0.68) 0–2 | W = 48.00, p = .26 |
| Sleep disturbance PSQI-C5 | 1.23 (0.48) 0–3 | 1.24 (0.50) 0–3 | W = 72.00, p = .83 | 1.15 (0.48) 0–2 | 1.55 (0.60) 0–3 | W = 00.00 p < .001 |
| Sleep pills PSQI-C6 | 0.58 (1.06) 0–3 | 0.61 (1.10) 0–3 | W = 9.00, p = .18 | 0.70 (1.18) 0–3 | 0.83 (1.26) 0–3 | W = 26.00 p = .56 |
| Daytime dysfunction PSQI-C7 | 0.74 (0.61) 0–3 | 0.74 (0.65) 0–3 | W = 297.00 p = 1.00 | 0.68 (0.70) 0–3 | 0.80 (0.46) 0–2 | W = 28.00, p = .18 |
| Naps | 2.17 (2.62) 0–7.25 | 2.21 (2.66) 0–7.75 | W = 189.00, p = .38 | 1.89 (2.54) 0–7.75 | 2.27 (2.38) 0–6.50 | W = 173.50, p = .51 |
Table 6
Statistical outcome of the linear regression models seeking for associations between changes in physical and mental fatigue (dependent variables) and changes in demographics, anxiety state, work-related activities, leisure activities, mental load, sleep and sleepiness and their sub-scores in (a) workers and (b) retirees during lockdown.
| VARIABLES | (a) WORKERS (N = 430) | (b) RETIREES (N = 130) | ||||||||||||||
|---|---|---|---|---|---|---|---|---|---|---|---|---|---|---|---|---|
| PHYSICAL FATIGUE | MENTAL FATIGUE | PHYSICAL FATIGUE | MENTAL FATIGUE | |||||||||||||
| B (SE) | β | t | p | B (SE) | β | t | p | B (SE) | β | t | p | B (SE) | β | t | p | |
| DEMOGRAPHICS | ||||||||||||||||
| Age | –0.04 (0.02) | –0.12 | –2.43 | .02 | –0.02 (0.02) | –0.06 | –1.10 | .27 | –0.02 (0.04) | –0.53 | –0.55 | .58 | –0.02 (0.04) | –0.05 | –0.53 | .60 |
| Gender (men) | 0.70 (0.54) | 0.06 | 1.30 | .20 | 0.38 (0.57) | 0.03 | 0.66 | .51 | 0.23 (0.58) | 0.04 | 0.40 | .69 | 0.42 (0.52) | 0.08 | 0.80 | .43 |
| Upper Secondary (vs Lower) | –6.03 (4.26) | –0.03 | –1.42 | .16 | –1.40 (4.49) | –0.07 | –0.31 | .76 | 0.31 (1.79) | 0.04 | 0.17 | .86 | 0.95 (1.61) | 0.15 | 0.59 | .56 |
| Bachelor (vs Lower Secondary) | –6.72 (4.20) | –0.69 | –1.60 | .11 | –1.71 (4.42) | –0.17 | –0.39 | .70 | 0.57 (1.78) | 0.10 | 0.32 | .75 | 1.36 (1.60) | 0.26 | 0.85 | .40 |
| Master (vs Lower Secondary) | –6.72 (4.19) | –0.74 | –1.60 | .11 | –1.10 (4.42) | –0.12 | –0.25 | .80 | 1.07 (1.74) | 0.18 | 0.62 | .54 | 1.67 (1.56) | 0.31 | 1.07 | .29 |
| ANXIETY STATE | ||||||||||||||||
| General anxiety | 0.43 (0.05) | 0.43 | 9.36 | <.001 | 0.48 (0.05) | 0.46 | 10.12 | <.001 | 1.38 (0.48) | 0.28 | 2.89 | .005 | 1.16 (0.42) | 0.27 | 2.77 | .01 |
| COVID-related anxiety | –0.02 (0.01) | –0.11 | –2.42 | .02 | –0.02 (0.01) | –0.14 | –3.02 | .003 | –0.0001 (0.01) | –0.001 | –0.009 | .99 | 0.01 (0.01) | 0.11 | 1.16 | .25 |
| WORK ACTIVITIES | ||||||||||||||||
| Work from home (yes) | –0.15 (0.54) | –0.02 | –0.28 | .78 | 1.76 (0.57) | 0.17 | 3.07 | .002 | – | – | – | – | – | – | – | – |
| Flexibility | 0.01 (0.01) | 0.12 | 2.38 | .02 | 0.01 (0.01) | 0.10 | 2.06 | .04 | – | – | – | – | – | – | – | – |
| Activity | 0.001 (0.01) | 0.01 | 0.14 | .89 | –0.01 (0.01) | –0.08 | –1.47 | .14 | – | – | – | – | – | – | – | – |
| LEISURE ACTIVITIES | ||||||||||||||||
| Screen exposure | 0.0001 (0.001) | 0.004 | –0.08 | .94 | 0.002 (0.002) | 0.06 | 1.14 | .26 | 0.01 (0.004) | 0.11 | 1.214 | .23 | 0.001 (0.004) | 0.03 | 0.31 | .75 |
| Outdoor activities | –0.01 (0.002) | –0.18 | –3.54 | <.001 | –0.004 (0.002) | –0.09 | –1.66 | .098 | – | – | – | – | – | – | – | – |
| Sports | – | – | – | – | – | – | – | – | –0.01 (0.004) | –0.29 | –3.222 | .002 | –0.01 (0.004) | –0.13 | –1.44 | .15 |
| MENTAL LOAD | ||||||||||||||||
| House duties | –0.01 (0.01) | –0.08 | –1.60 | .11 | –0.01 (0.01) | –0.07 | –1.45 | .15 | – | – | – | – | – | – | – | – |
| Social interactions | –0.03 (0.01) | –0.18 | –3.78 | <.001 | –0.02 (0.01) | –0.16 | –3.39 | .001 | –0.01 (0.01) | –0.05 | –0.51 | .61 | –0.001 (0.01) | –0.006 | –0.06 | .95 |
| Work | –0.02 (0.01) | –0.14 | –3.22 | .001 | –0.03 (0.01) | –0.21 | –4.85 | <.001 | – | – | – | – | – | – | – | – |
| Leisure | –0.03 (0.01) | –0.29 | –5.68 | <.001 | –0.04 (0.01) | –0.32 | –6.62 | <.001 | – | – | – | – | – | – | – | – |
| SLEEP & SLEEPINESS | ||||||||||||||||
| ESS | 0.12 (0.06) | 0.10 | 2.24 | .03 | 0.17 (0.06) | 0.14 | 3.05 | .002 | 0.13 (0.13) | 0.09 | 0.99 | .33 | 0.16 (0.11) | 0.13 | 1.43 | .16 |
| PSQI C1 | 1.54 (0.26) | 0.34 | 5.86 | <.001 | 1.44 (0.27) | 0.30 | 5.28 | <.001 | – | – | – | – | – | – | – | – |
| PSQI C2 | –0.05 (0.24) | –0.01 | –0.19 | .85 | 0.02 (0.25) | 0.004 | 0.08 | .94 | – | – | – | – | – | – | – | – |
| PSQI C4 | 0.64 (0.23) | 0.13 | 2.74 | .01 | 0.62 (0.24) | 0.12 | 2.57 | .01 | –0.35 (0.49) | –0.06 | –0.71 | .48 | –0.16 (0.45) | –0.03 | –0.37 | .71 |
| PSQI C5 | –0.11 (0.39) | –0.01 | –0.29 | .78 | 0.64 (0.40) | 0.08 | 1.59 | .11 | – | – | – | – | – | – | – | – |
| Naps | –0.01 (0.11) | –0.004 | –0.09 | .93 | 0.02 (0.11) | 0.01 | 0.21 | .83 | – | – | – | – | – | – | – | – |
[i] Note. B: unstandardized coefficient estimates. SE: Standard errors. β: standardized coefficient estimates. t: t-value for testing the null hypothesis. p: p-value.
Table 7
Explanatory statistical outcome of the linear regression models seeking for associations between changes in physical and mental fatigue (dependent variables) and changes in demographics, anxiety state, work-related activities, leisure activities, mental load, sleep and sleepiness and their sub-scores in (a) workers and (b) retirees one-year post-lockdown.
| VARIABLES | (a) WORKERS (N = 133) | (b) RETIREES (N = 40) | ||||||||||||||
|---|---|---|---|---|---|---|---|---|---|---|---|---|---|---|---|---|
| PHYSICAL FATIGUE | MENTAL FATIGUE | PHYSICAL FATIGUE | MENTAL FATIGUE | |||||||||||||
| B (SE) | β | t | p | B (SE) | β | t | p | B (SE) | β | t | p | B (SE) | β | t | p | |
| DEMOGRAPHICS | ||||||||||||||||
| Age | –0.001 (0.03) | –0.004 | –0.05 | .96 | 0.02 (0.04) | 0.06 | 0.66 | .51 | –0.07 (0.10) | –0.14 | –0.76 | .45 | 0.07 (0.08) | 0.15 | 0.89 | .38 |
| Gender (men) | –1.12 (0.80) | –0.13 | –1.41 | .16 | 0.17 (0.92) | 0.02 | 0.18 | .86 | 0.91 (1.04) | 0.15 | 0.88 | .39 | 1.45 (0.86) | 0.27 | 1.69 | .10 |
| Upper Secondary (vs Lower) | – | – | – | – | – | – | – | – | 0.01 (3.57) | 0.001 | 0.002 | 1.00 | –0.70 (2.94) | –0.09 | –0.24 | .82 |
| Bachelor (vs Lower Secondary) | 1.24 (1.63) | 0.15 | 0.76 | .45 | –0.79 (1.90) | –0.08 | –.41 | .68 | –0.50 (3.34) | –0.08 | –0.15 | .88 | –0.49 (2.75) | –0.09 | –0.18 | .86 |
| Master (vs Lower Secondary) | 1.50 (1.58) | 0.19 | 1.58 | .34 | –1.30 (1.82) | –0.14 | –0.71 | .48 | –1.60 (3.47) | –0.26 | –0.46 | .65 | –2.71 (2.86) | –0.49 | –0.95 | .35 |
| ANXIETY STATE | ||||||||||||||||
| General anxiety | 0.29 (0.08) | 0.33 | 3.79 | <.001 | 0.35 (0.09) | 0.34 | 3.98 | <.001 | 0.05 (0.18) | 0.05 | 0.30 | .77 | 0.19 (0.16) | 0.20 | 1.18 | .25 |
| COVID-related anxiety | –0.01 (0.01) | –0.13 | –1.48 | .14 | –0.02 (0.01) | –0.16 | –1.81 | .07 | –0.01 (0.02) | –0.11 | –0.64 | .53 | –0.001 | –0.01 | –0.07 | .94 |
| WORK ACTIVITIES | ||||||||||||||||
| Work from home (yes) | 0.67 (0.74) | 0.09 | 0.91 | .37 | –0.93 (0.84) | –0.11 | –1.11 | .27 | – | – | – | – | – | – | – | – |
| Flexibility | –0.01 (0.01) | –0.06 | –0.64 | .53 | .02 (0.01) | 0.15 | 1.62 | .11 | – | – | – | – | – | – | – | – |
| Activity | –0.02 (0.01) | –0.19 | –2.00 | .05 | –0.03 (0.01) | –0.22 | –2.40 | .02 | – | – | – | – | – | – | – | – |
| LEISURE ACTIVITIES | ||||||||||||||||
| Outdoor activities | –0.001 (0.00) | –0.13 | –1.46 | .15 | –0.001 (0.00) | –0.03 | –0.36 | .72 | – | – | – | – | – | – | – | – |
| MENTAL LOAD | ||||||||||||||||
| House duties | –0.01 (0.01) | –0.09 | –0.92 | .36 | –0.006 (0.01) | –0.06 | –0.60 | .55 | – | – | – | – | – | – | – | – |
| Leisure | 0.01 (0.01) | 0.10 | 1.01 | .31 | –0.002 (0.01) | –0.02 | –0.19 | .85 | – | – | – | – | – | – | – | – |
| SLEEP & SLEEPINESS | ||||||||||||||||
| ESS | –0.01 (0.07) | –0.01 | –0.12 | .91 | –0.07 (0.08) | –0.08 | –0.87 | .39 | 0.18 (0.19) | 0.16 | 0.97 | .34 | 0.08 (0.17) | 0.07 | 0.44 | .66 |
| PSQI C1 | 0.16 (0.25) | 0.06 | 0.64 | .53 | 0.53 (0.29) | 0.17 | 1.84 | .07 | – | – | – | – | – | – | – | – |
| PSQI C3 | –0.02 (0.33) | –0.006 | –0.06 | .95 | –0.05 (0.37) | –0.01 | –0.14 | .89 | – | – | – | – | – | – | – | – |
| PSQI C5 | 0.57 (0.53) | 0.10 | 1.09 | .28 | 0.98 (0.60) | 0.15 | 1.63 | .11 | 0.93 (0.96) | 0.16 | .97 | .34 | 0.65 (0.87) | 0.12 | 0.75 | .46 |
| Naps | 0.22 (0.17) | 0.13 | 1.32 | .19 | –0.05 (0.19) | –0.02 | –0.25 | .80 | – | – | – | – | – | – | – | – |
[i] Note. B: unstandardized coefficient estimates. SE: Standard errors. β: standardized coefficient estimates. t: t-value for testing the null hypothesis. p: p-value.