
Table 1
Frequencies of five NSSI behaviors for the total sample and in function of gender and age.
| TOTAL | GIRLS | BOYS | AGE GROUP 1 (AGE 9–12) | AGE GROUP 2 (AGE 13–17) | ||||||||
|---|---|---|---|---|---|---|---|---|---|---|---|---|
| % | N | % | N | % | N | χ² (φ) | % | N | % | N | χ² (φ) | |
| Cutting | 8.90 | 41 | 9.48 | 22 | 8.22 | 19 | 0.23 (.02) | 8.37 | 18 | 9.31 | 23 | 0.12 (.02) |
| Burning | 3.50 | 16 | 2.59 | 6 | 4.33 | 10 | 1.05 (–.05) | 5.12 | 11 | 2.02 | 5 | 3.25 (–.08) |
| Beating | 19 | 88 | 17.24 | 40 | 20.78 | 48 | 0.94 (–.04) | 30.70 | 66 | 8.91 | 22 | 35.40*** (–.28) |
| Head-banging | 21.60 | 100 | 18.53 | 43 | 24.78 | 57 | 2.66 (–.08) | 30.37 | 65 | 14.17 | 35 | 17.72*** (–.20) |
| Scratching | 16.20 | 75 | 12.50 | 29 | 19.91 | 46 | 4.69* (–.10) | 22.32 | 48 | 10.93 | 27 | 10.97** (–.15) |
[i] Note: * p < .05, ** p < .01, *** p < .001.
Table 2
Means, standard deviations and ranges of all friendship quality variables for the total sample, and in function of gender (controlled for age) and age (controlled for gender).
| TOTAL | GIRLS | BOYS | F (ηp2) | AGE GROUP 1 (AGE 9–12) | AGE GROUP 2 (AGE 13–17) | F (ηp2) | RANGE | |
|---|---|---|---|---|---|---|---|---|
| M (SD) | M (SD) | M (SD) | M (SD) | M (SD) | ||||
| Total FQ | 89.40 (13.16) | 93.98 (11.36) | 84.71 (13.24) | 64.30*** (.13) | 87.16 (14.42) | 91.38 (11.61) | 13.97*** (.03) | 43–113 |
| Companionship | 14.11 (3.10) | 14.77 (2.87) | 13.43 (3.19) | 22.31*** (.05) | 13.57 (3.36) | 14.58 (2.78) | 12.73*** (.03) | 4–20 |
| Conflict | 8.38 (3.02) | 8.21 (2.94) | 8.55 (3.10) | 1.55 (.004) | 8.56 (3.23) | 8.23 (2.82) | 1.33 (.003) | 4–20 |
| Help | 20.22 (3.95) | 21.32 (3.45) | 19.10 (4.13) | 39.23*** (.08) | 19.33 (4.42) | 21 (3.31) | 23.16*** (.05) | 5–25 |
| Security | 19.74 (3.75) | 21.17 (3.14) | 18.28 (3.76) | 80.37*** (.15) | 19.20 (3.95) | 20.23 (3.50) | 10.61** (.02) | 9–25 |
| Closeness | 19.72 (3.72) | 20.94 (3.03) | 18.48 (3.94) | 53.73 *** (.11) | 19.63 (3.98) | 19.80 (3.47) | 0.34 (.001) | 5–25 |
[i] Note: Total FQ = Total score of the Friendship Qualities Scale (FQS).
* p < .05, ** p < .01, *** p < .001.
Table 3
Correlations between the (dimensions of) friendship quality and lifetime NSSI.
| LIFETIME NSSI | |||||
|---|---|---|---|---|---|
| TOTAL | GIRLS | BOYS | AGE GROUP 1 (AGE 9–12) | AGE GROUP 2 (AGE 13–17) | |
| Total FQ | –.11* | –.24*** | .03 | –.23** | .11 |
| Companionship | –.04 | –.06 | .003 | –.09 | .10 |
| Conflict | .14** | .22** | .06 | .10 | .18** |
| Help | –.10* | –.21** | .005 | –.23** | .17** |
| Security | –.13** | –.26*** | –.001 | –.27** | .08 |
| Closeness | 0 | –.12 | .13 | –.15* | .19** |
[i] Note: Total FQ = Total score of the Friendship Qualities Scale (FQS).
* p < .05, ** p < .01, *** p < .001.
Table 4
Prediction of lifetime NSSI based on total friendship quality, gender, age and their interactions.
| STEP | VARIABLES | B | WALD’S χ² | NAGELKERKE R² |
|---|---|---|---|---|
| Step 1 | Total FQ | –0.15 | 1.80 | .07 |
| Gender | 0.16 | 0.53 | ||
| Age | –0.42 | 15.81*** | ||
| Step 2 | Total FQ | 0.27 | 2.72 | .12 |
| Gender | 0.23 | 1.05 | ||
| Age | –0.42 | 14.39*** | ||
| Total FQ × gender | –0.63 | 7.17** | ||
| Total FQ × age | 0.37 | 9.73** |
[i] Note: Total FQ = Total score of the Friendship Qualities Scale (FQS).
* p < .05, ** p < .01, *** p < .001.
Table 5
Prediction of lifetime NSSI based on companionship, gender, age and their interactions.
| STEP | VARIABLES | B | WALD’S χ² | NAGELKERKE R² |
|---|---|---|---|---|
| Step 1 | Companionship | 0.03 | 0.07 | .06 |
| Gender | 0.28 | 1.74 | ||
| Age | –0.45 | 17.86*** | ||
| Step 2 | Companionship | 0.16 | 1.25 | .07 |
| Gender | 0.29 | 1.88 | ||
| Age | –0.47 | 18.51*** | ||
| Companionship × gender | –0.13 | 0.39 | ||
| Companionship × age | 0.21 | 3.49 |
[i] * p < .05, ** p < .01, *** p < .001.
Table 6
Prediction of lifetime NSSI based on conflict, gender, age and their interactions.
| STEP | VARIABLES | B | WALD’S χ² | NAGELKERKE R² |
|---|---|---|---|---|
| Step 1 | Conflict | 0.30 | 8.34 | .09 |
| Gender | 0.24 | 1.39 | ||
| Age | –0.44 | 18.09*** | ||
| Step 2 | Conflict | 0.17 | 1.35 | .10 |
| Gender | 0.26 | 1.54 | ||
| Age | –0.45 | 18.05*** | ||
| Conflict × gender | 0.34 | 2.67 | ||
| Conflict × age | 0.10 | 0.82 |
[i] * p < .05, ** p < .01, *** p < .001.
Table 7
Prediction of lifetime NSSI based on help, gender, age and their interactions.
| STEP | VARIABLES | B | WALD’S χ² | NAGELKERKE R² |
|---|---|---|---|---|
| Step 1 | Help | –0.10 | 0.94 | .06 |
| Gender | 0.20 | 0.90 | ||
| Age | –0.42 | 15.43*** | ||
| Step 2 | Help | 0.32 | 3.75 | .12 |
| Gender | 0.27 | 1.58 | ||
| Age | –0.47 | 16.39*** | ||
| Help × gender | –0.51 | 5.06* | ||
| Help × age | 0.43 | 12.78*** |
[i] * p < .05, ** p < .01, *** p < .001.
Table 8
Prediction of lifetime NSSI based on security, gender, age and their interactions.
| STEP | VARIABLES | B | WALD’S χ² | NAGELKERKE R² |
|---|---|---|---|---|
| Step 1 | Security | –0.21 | 3.49 | .07 |
| Gender | 0.10 | 0.21 | ||
| Age | –0.41 | 15.38*** | ||
| Step 2 | Security | 0.17 | 1.16 | .13 |
| Gender | 0.12 | 0.29 | ||
| Age | –0.39 | 12.90*** | ||
| Security × gender | –0.71 | 8.23** | ||
| Security × age | 0.37 | 10.18** |
[i] * p < .05, ** p < .01, *** p < .001.
Table 9
Prediction of lifetime NSSI based on closeness, gender, age and their interactions.
| STEP | VARIABLES | B | WALD’S χ² | NAGELKERKE R² |
|---|---|---|---|---|
| Step 1 | Closeness | 0.05 | 0.20 | .06 |
| Gender | 0.29 | 1.80 | ||
| Age | –0.44 | 17.95*** | ||
| Step 2 | Closeness | 0.45 | 7.82 | .12 |
| Gender | 0.34 | 2.34 | ||
| Age | –0.46 | 17.30*** | ||
| Closeness × gender | –0.59 | 6.12* | ||
| Closeness × age | 0.43 | 13*** |
[i] * p < .05, ** p < .01, *** p < .001.
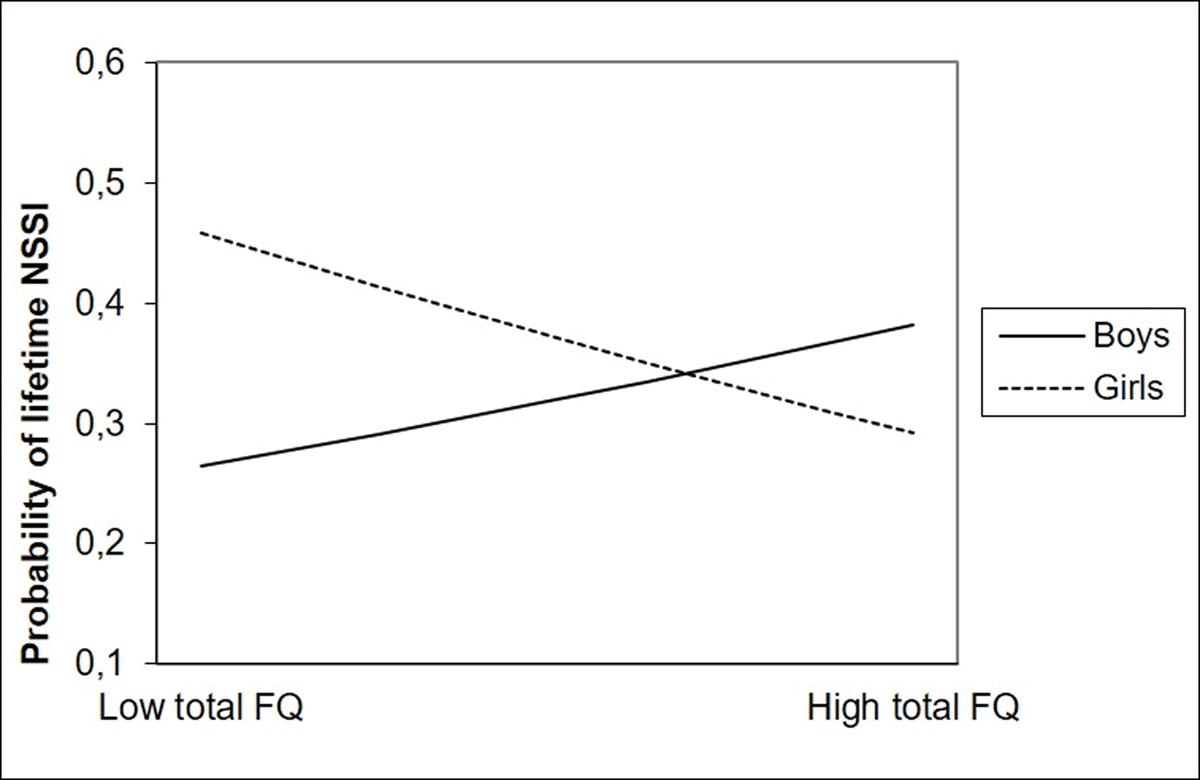
Figure 1
Interaction between total friendship quality and gender in the prediction of lifetime NSSI.
Note: Total FQ = Total score of the Friendship Qualities Scale (FQS).
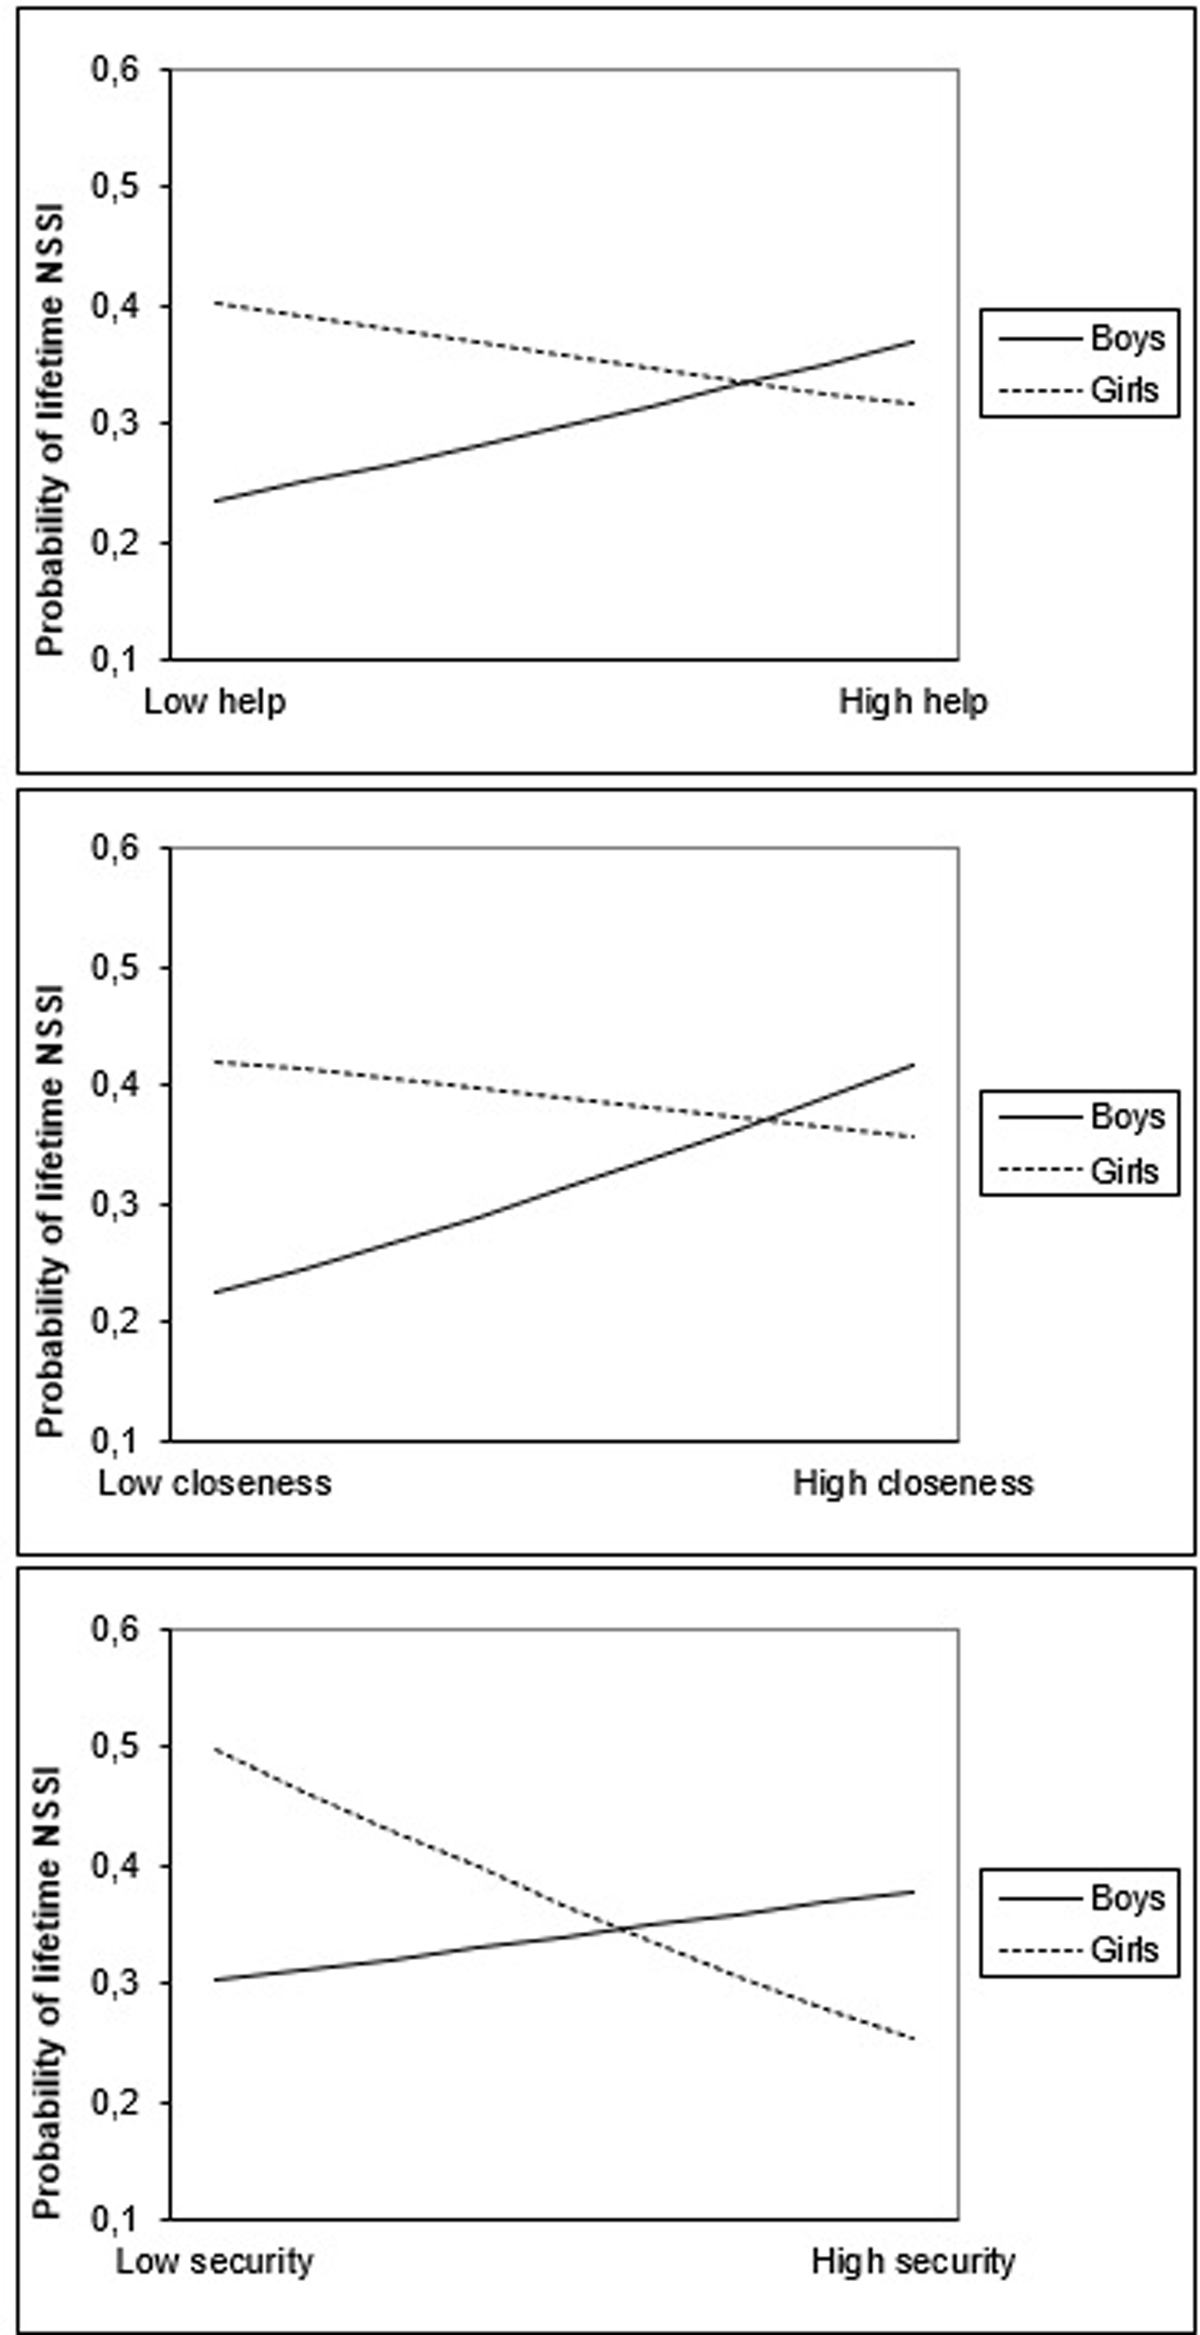
Figure 2
Interaction between help and gender, security and gender, and closeness and gender in the prediction of lifetime NSSI.
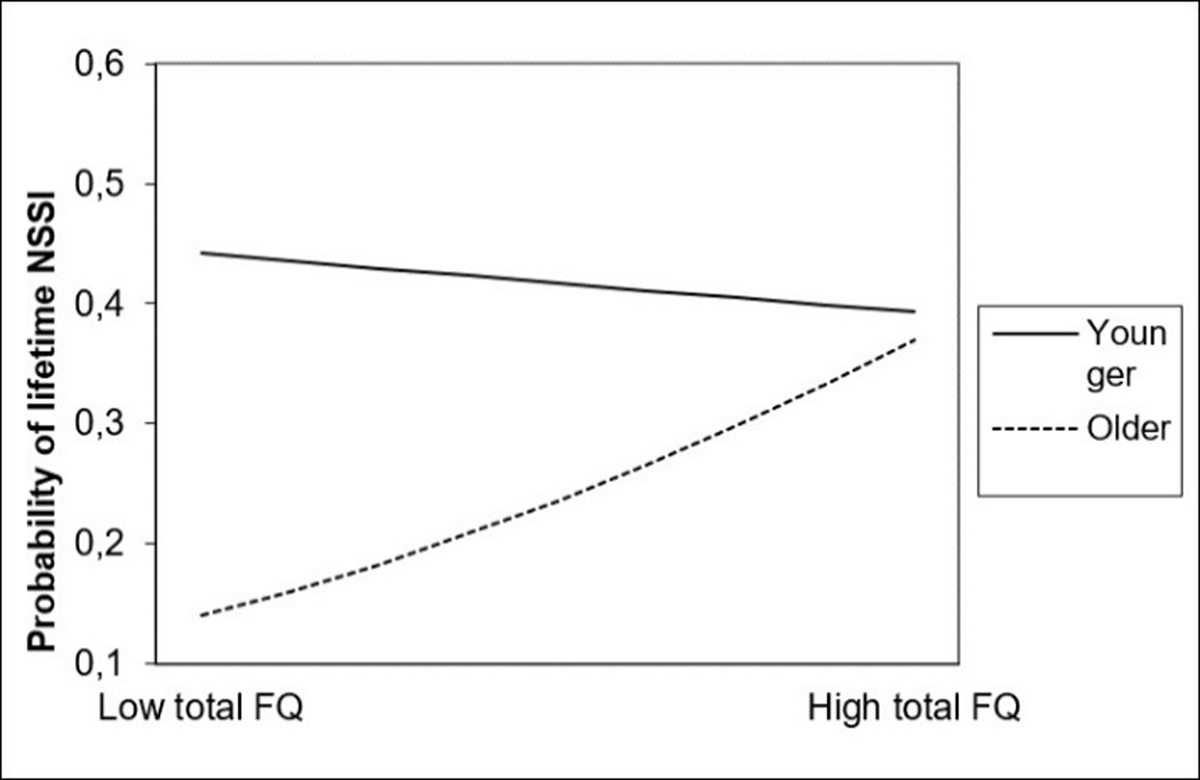
Figure 3
Interaction between total friendship quality and age in the prediction of lifetime NSSI.
Note: Total FQ = Total score of the Friendship Qualities Scale (FQS). Younger = age at one standard deviation under mean age; Older = age at one standard deviation above mean age.
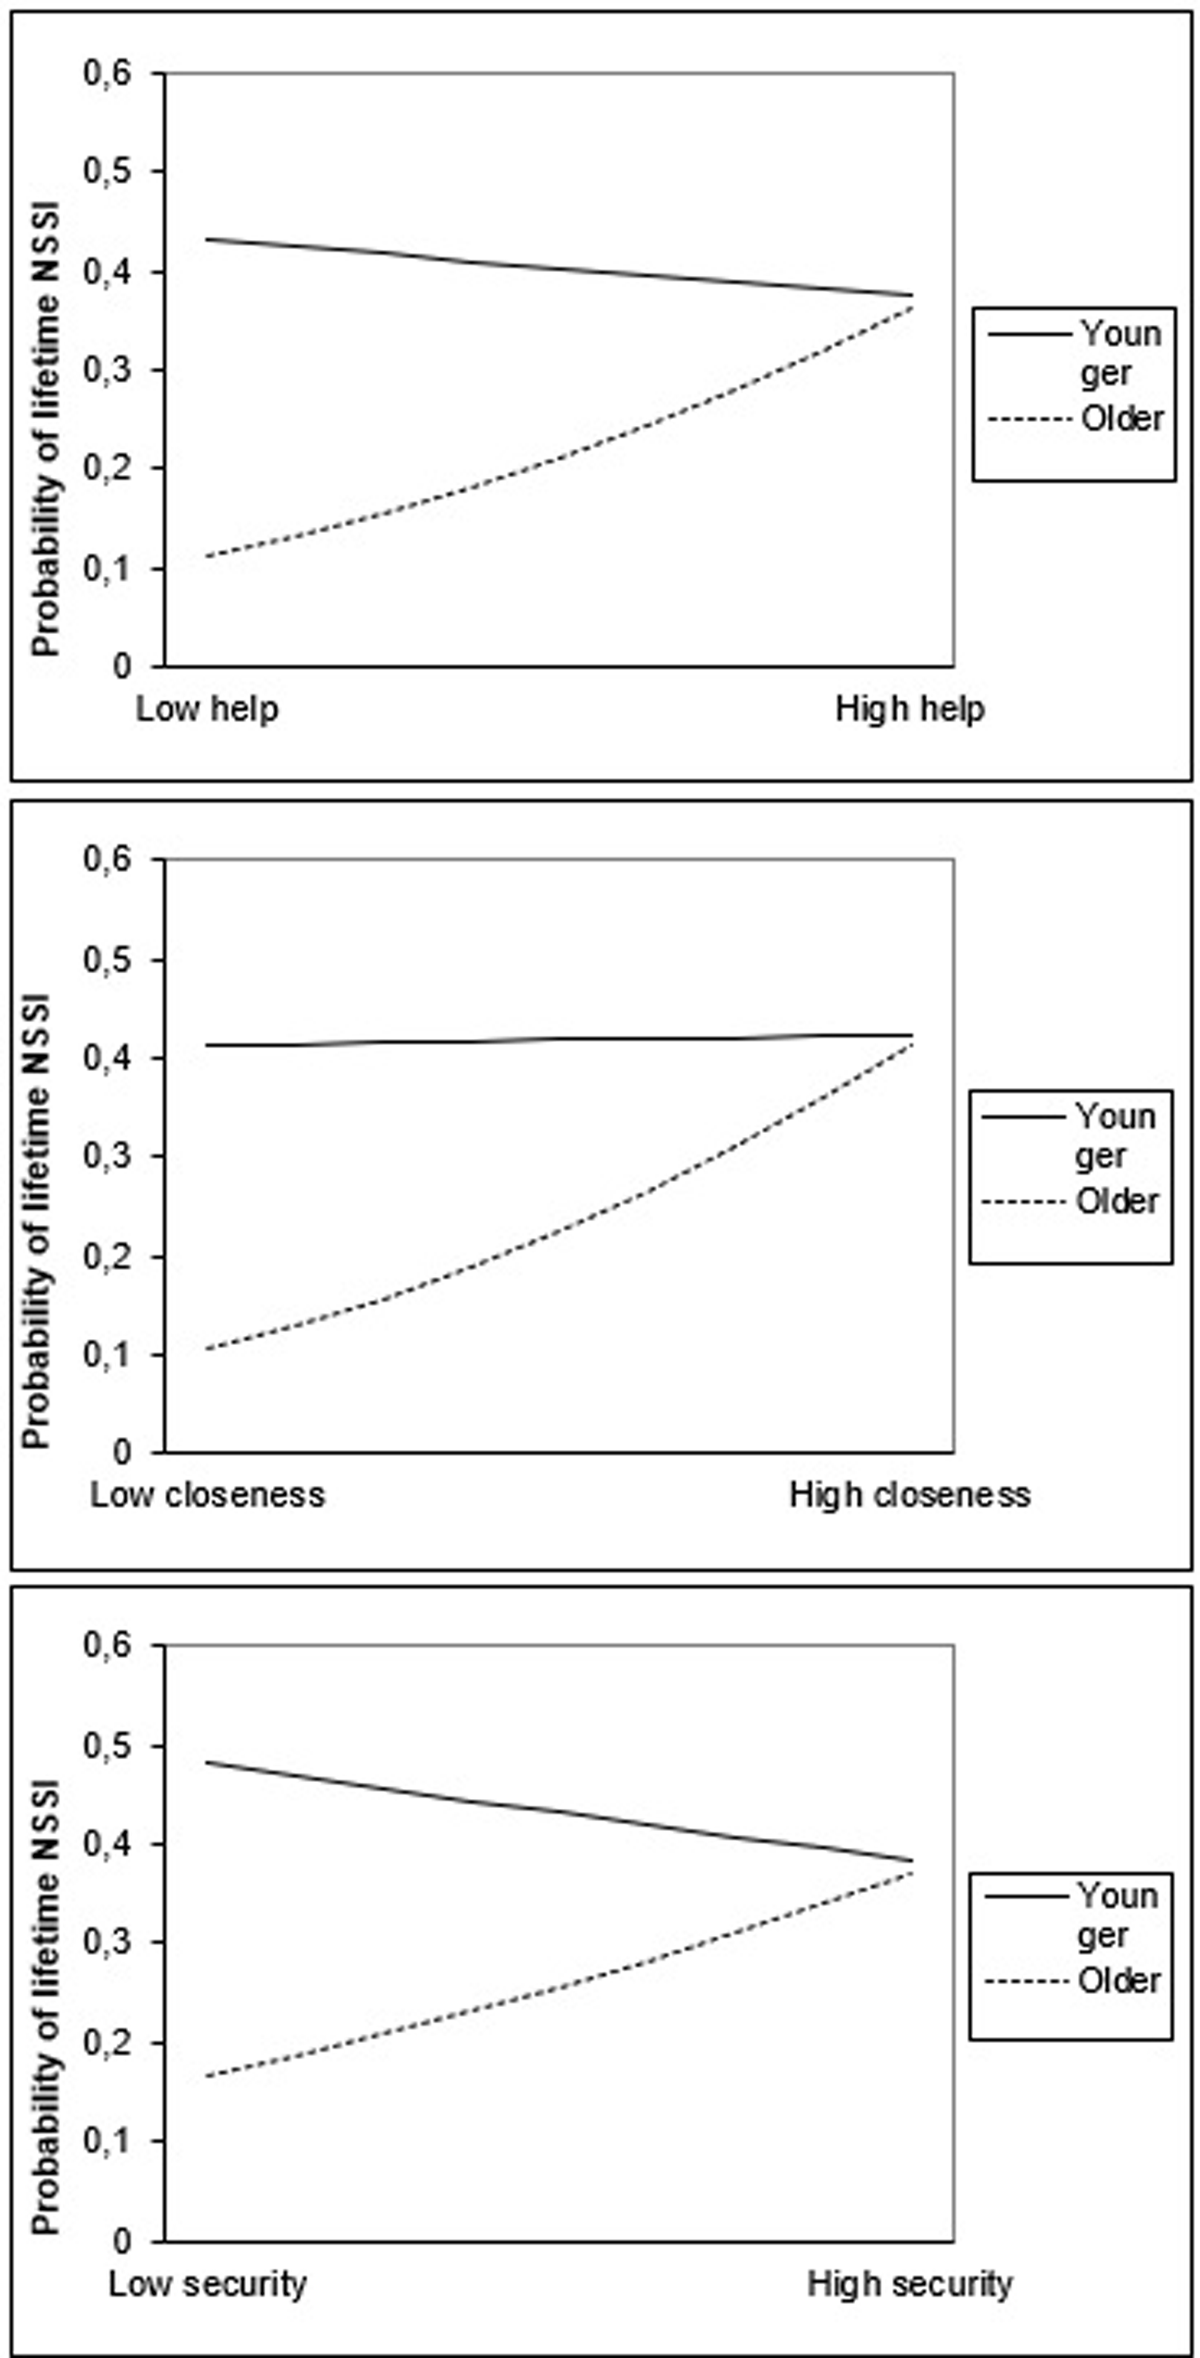
Figure 4
Interactions between help and age, closeness and age, and security and age in the prediction of lifetime NSSI.
Note: Younger = age at one standard deviation under mean age; Older = age at one standard deviation above mean age.