
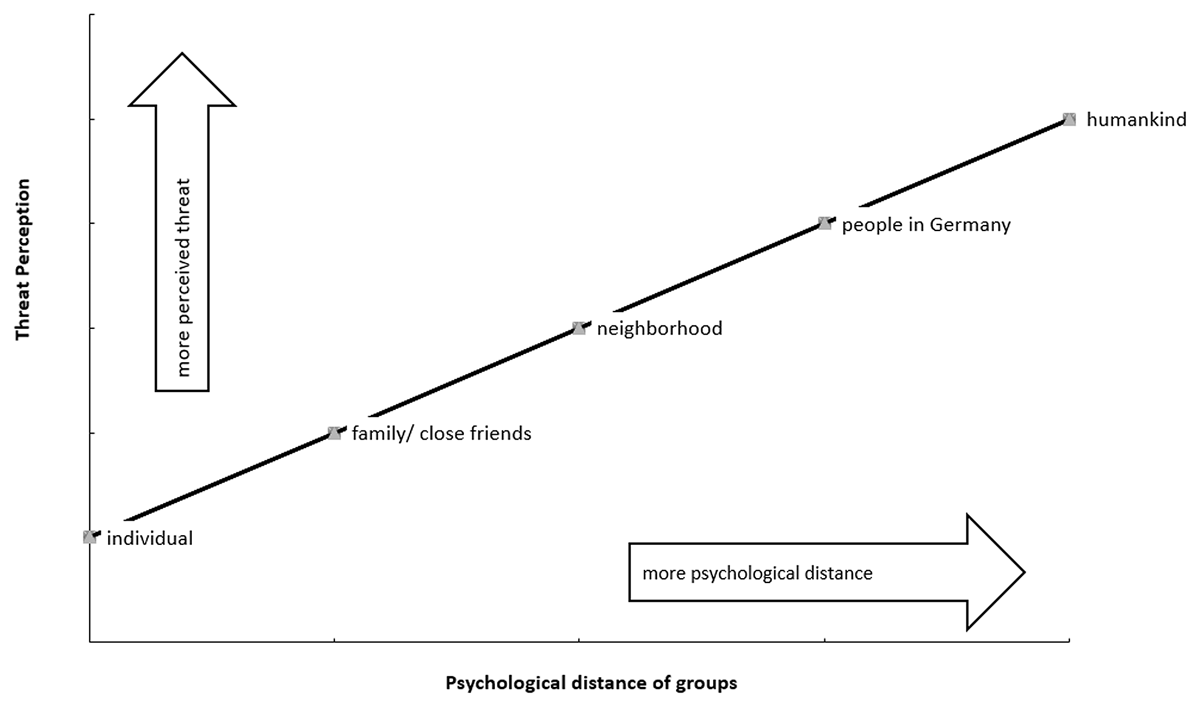
Figure 1
Simplified visualization of the threat target pattern (i.e., threat target slope).
Table 1
Means (M) and Standard Deviations (SD) for N = 1454 (T1) and N = 989 (T2).
| T1 | T2 | ||||
|---|---|---|---|---|---|
| M | SD | M | SD | ||
| 1 Threat for the individual | 3.11 | 1.08 | 2.86 | 1.06 | |
| 2 Threat for family/close friends | 3.29 | 0.99 | 2.99 | 1.02 | |
| 3 Threat for neighborhood | 3.20 | 0.92 | 2.99 | 0.92 | |
| 4 Threat for country members | 3.80 | 0.82 | 3.36 | 0.91 | |
| 5 Threat for humankind | 4.06 | 0.87 | 3.71 | 0.96 | |
| 6 Threat by family/close friends | 2.12 | 1.17 | 2.00 | 1.13 | |
| 7 Threat by neighborhood | 2.31 | 1.18 | 2.21 | 1.14 | |
| 8 Threat by country members | 3.07 | 1.19 | 2.81 | 1.15 | |
| 9 Threat by people from different countries | 2.89 | 1.32 | 2.60 | 1.24 | |
| 10 Identification with humankind | 3.88 | 0.83 | 3.82 | 0.85 | |
| 11 Adherence to Covid-19 health guidelines | 4.15 | 0.65 | 3.95 | 0.66 | |
Table 2
Correlations for N = 1454 (T1) and N = 989 (T2).
| 1 | 2 | 3 | 4 | 5 | 6 | 7 | 8 | 9 | 10 | 11 | 12 | 13 | 14 | 15 | |
|---|---|---|---|---|---|---|---|---|---|---|---|---|---|---|---|
| 1 Gender1 | .15*** | –.06 | .00 | –.00 | –.01 | .03 | –.03 | .01 | .02 | –.01 | –.06 | –.04 | –.03 | –.16*** | |
| 2 Age | .15*** | .33*** | –.37*** | .11*** | .02 | .07* | .06 | .10*** | –.12*** | –.09** | –.04 | –.05 | .17*** | .06* | |
| 3 Children2 | –.05 | .36*** | –.10** | .06 | .01 | .09** | .05 | .07* | –.01 | .02 | .04 | .07* | .11*** | .12*** | |
| 4 Job2 | –.02 | –.34*** | –.08** | –.04 | –.03 | –.02 | –.06 | –.08* | .03 | –.02 | .00 | .02 | –.06 | .03 | |
| 5 Threat for the individual | –.06* | .09*** | .09*** | –.03 | .81** | .70*** | .59*** | .46*** | .41*** | .41*** | .48*** | .34*** | .11*** | .34*** | |
| 6 Threat for family/close friends | –.12*** | –.03 | .04 | –.06* | .74*** | .74*** | .63*** | .51*** | .41*** | .42*** | .48*** | .32*** | .13*** | .37*** | |
| 7 Threat for neighborhood | –.05 | .03 | .06* | –.04 | .69*** | .75*** | .66*** | .51*** | .33*** | .44*** | .45*** | .31*** | .17*** | .37*** | |
| 8 Threat for country members | –.08** | .08** | .09** | –.03 | .47*** | .50*** | .50*** | .77*** | .24*** | .34*** | .48*** | .33*** | .16*** | .40*** | |
| 9 Threat for humankind | –.09** | .12*** | .08** | –.03 | .36*** | .37*** | .38*** | .75*** | .17*** | .25*** | .43*** | .29*** | .23*** | .40*** | |
| 10 Threat by family/close friends | .03 | –.14*** | .02 | .05 | .39*** | .36*** | .35*** | .17*** | .09*** | .65*** | .48*** | .43*** | .00 | .13*** | |
| 11 Threat by neighborhood | .03 | –.11*** | .02 | .02 | .40*** | .36*** | .43*** | .20*** | .12*** | .65*** | .66*** | .50*** | .00 | .19*** | |
| 12 Threat by country members | –.04 | –.09*** | .03 | .01 | .39*** | .39*** | .39*** | .38*** | .32*** | .46*** | .59*** | .63*** | .04 | .31*** | |
| 13 Threat by people from different countries | –.00 | –.04 | .06* | .02 | .31*** | .29*** | .34*** | .29*** | .25*** | .41*** | .52*** | .67*** | .02 | .17*** | |
| 14 Identification with humankind | –.03 | .11*** | .09*** | –.04 | .04 | .09*** | .07** | .15*** | .19*** | –.06* | –.04 | –.06* | –.10*** | .30*** | |
| 15 Adherence to Covid–19 health guidelines | –.18*** | .03 | .06* | .05 | .23*** | .27*** | .23*** | .32*** | .31*** | .03 | .10*** | .20*** | .15*** | .33*** |
[i] Note: * = p < .05, ** = p < .01, *** = p < .001. Correlational coefficients for study 1 (T1) under and for study 2 (T2) over the diagonal. 1 woman = 0, man = 1, other = 2. 2 no = 0, yes = 1.
Table 3
Competing Trajectory Models at T1.
| MODEL | X2 | DF | P VALUE | TLI | CFI | RMSEA | SRMR | 90% C.I RMSEA | AIC | BIC | SCALING CORRECTION | MODEL COMPARISON | SB-ΔX2 | ΔDF | |
|---|---|---|---|---|---|---|---|---|---|---|---|---|---|---|---|
| LL | UL | ||||||||||||||
| Threat Target | |||||||||||||||
| Model 1a: Intercept Only | 2596.17 | 10 | <.001 | 0.00 | 0.00 | 0.42 | 0.41 | 0.408 | 0.435 | 19596.21 | 19649.04 | 1.6157 | Model 1a vs. Model 2a | not identified | 0 |
| Model 2a: Fully Constrained | 624.52 | 10 | <.001 | 0.76 | 0.76 | 0.21 | 0.08 | 0.192 | 0.219 | 16197.86 | 16250.68 | 1.2748 | Model 2a vs. Model 3a | 418.06* | 3 |
| Model 3a: Partially Constrained | 74.18 | 7 | <.001 | 0.97 | 0.96 | 0.08 | 0.05 | 0.065 | 0.098 | 15488.39 | 15557.05 | 1.0877 | Model 3a vs. Model 1a | 1444.66* | 3 |
| Threat Source | |||||||||||||||
| Model 1b: Intercept Only | 1559.19 | 6 | <.001 | 0.00 | 0.00 | 0.42 | 0.37 | 0.404 | 0.440 | 18751.12 | 18793.38 | 1.5359 | Model 1b vs. Model 2b | 495.99* | 1 |
| Model 2b: Fully Constrained | 402.24 | 5 | <.001 | 0.74 | 0.69 | 0.23 | 0.13 | 0.215 | 0.253 | 16779.63 | 16827.17 | 1.0473 | Model 2b vs. Model 3b | 317.09* | 2 |
| Model 3b: Partially Constrained | 16.24 | 3 | .001 | 0.99 | 0.98 | 0.06 | 0.03 | 0.031 | 0.083 | 16376.82 | 16434.92 | 0.8902 | Model 3b vs. Model 1b | 1091.08* | 3 |
[i] X2 = Chi-square; df = degrees of freedom; TLI = Tucker-Lewis Index; CFI = Comparative Fit Index; RMSEA = Root Mean Square Error of Approximation; SRMR = Standardised Root Mean Square Residual; AIC = Akaike Information Criterion; BIC = Bayes Information Criterion; LL = Lower Level; UL = Upper Level; * statistically significant (p < 0.05); SB-ΔX2 Satorra-Bentler Scaled Chi Square Diff test.
Table 4
Competing Trajectory Models at T2.
| MODEL | X2 | DF | P VALUE | TLI | CFI | RMSEA | SRMR | 90% C.I RMSEA | AIC | BIC | SCALING CORRECTION | MODEL COMPARISON | SB–ΔX2 | ΔDF | |
|---|---|---|---|---|---|---|---|---|---|---|---|---|---|---|---|
| LL | UL | ||||||||||||||
| Threat Target | |||||||||||||||
| Model 1a: Intercept Only | 1918.24 | 10 | <.001 | .00 | .00 | .44 | .46 | .423 | .456 | 13766.98 | 13815.94 | 1.8083 | Model 1a vs. Model 2a | not identified | 0 |
| Model 2a: Fully Constrained | 262.43 | 10 | <.001 | .87 | .87 | .16 | .07 | .143 | .177 | 10626.44 | 10675.41 | 1.2507 | Model 2a vs. Model 3a | 126.23* | 3 |
| Model 3a: Partially Constrained | 88.48 | 7 | <.001 | .96 | .94 | .11 | .06 | .089 | .129 | 10401.31 | 10464.97 | 1.0974 | Model 3a vs. Model 1a | 971.73* | 3 |
| Threat Source | |||||||||||||||
| Model 1b: Intercept Only | 956.18 | 6 | <.001 | .00 | .00 | .40 | .37 | .379 | .422 | 12426.21 | 12465.39 | 1.7218 | Model 1b vs. Model 2b | 298.51* | 1 |
| Model 2b: Fully Constrained | 245.24 | 5 | <.001 | .75 | .70 | .22 | .10 | .197 | .244 | 11061.54 | 11105.61 | 1.1404 | Model 2b vs. Model 3b | 162.65* | 2 |
| Model 3b: Partially Constrained | 33.93 | 3 | <.001 | .97 | .94 | .10 | .06 | .073 | .134 | 10815.59 | 10869.45 | 0.8762 | Model 3b vs. Model 1b | 629.67* | 3 |
[i] X2 = Chi-square; df = degrees of freedom; TLI = Tucker-Lewis Index; CFI = Comparative Fit Index; RMSEA = Root Mean Square Error of Approximation; SRMR = Standardised Root Mean Square Residual; AIC = Akaike Information Criterion; BIC = Bayes Information Criterion; LL = Lower Level; UL = Upper Level; * statistically significant (p < 0.05); SB–ΔX2 Satorra-Bentler Scaled Chi Square Diff test.