
Table 1
Demographic features of original and follow-up testing samples.
| ORIGINAL SAMPLE (S1–S2) | RANGE S1–S2 | FOLLOW–UP SAMPLE (S3) | RANGE S3 | |
|---|---|---|---|---|
| Age | 55.95 (9.15) | 42–73 | 55.25 (10.17) | 42–73 |
| PSQI | 8.21 (4.06) | 2–16 | 7.73 (4.92) | 2–16 |
| ESS | 8.65 (4.65) | 3–20 | 9.17 (4.90) | 3–20 |
| FSS | 3.76 (1.87) | 1,22–7 | 3.85 (1.98) | 1,22–7 |
| Mental BFS | 3.55 (2.69) | 0–9 | 1.5 (0.25–3) | 0–8 |
| Physical BFS | 4.3 (2.66) | 0–10 | 3.5 (2.20) | 0–8 |
| Morningness-Eveningness scale | 21.5 (8.61) | 12–40 | 20 (7.19) | 12–32 |
| Distinctness scale | 17.10 (7.21) | 6–30 | 16 (8) | 6–30 |
| HADS Total | 12.45 (5.79) | 3–28 | 12.08 (6.68) | 3–28 |
| HADS Anxiety | 6.5 (3.46) | 2–15 | 6.08 (3.61) | 2–15 |
| HADS Depression | 5.95 (3.66) | 1–13 | 6 (3.98) | 1–13 |
| Mill Hill | 21.57 (6.82) | 4–33 | 23.58 (5.14) | 14–33 |
| Phonological fluency | 22.20 (6.98) | 13–38 | 21.08 (7.38) | 13–38 |
| Semantical fluency | 26.29 (6.51) | 15–38 | 27.25 (6.06) | 18–36 |
| Reciprocal reaction time (PVT) | 3.03 (.26) | 2.48–3.46 | 3.02 (0.20) | 2.71–3.34 |
[i] Note: For the original testing sample (sessions S1 and S2), n = 23 except PSQI n = 21. For the follow-up sample (session S3), n = 12 except PSQI n = 11. PSQI = Pittsburgh Sleep Quality Index (PSQI, sleep quality of the previous month; Buysse et al., 1989); FSS = Fatigue Severity Scale (Krupp et al., 1989). BFS = Brugmann Fatigue Scale (Mairesse et al., 2017). ESS = Epworth Sleepiness Scale (Johns 1991). HADS = Hospital Anxiety and Depression Scale (Zigmond & Snaith, 1983). PVT = Psychomotor Vigilance Test (Basner et al., 2015). Data are given as mean (SD) or median (quartile 1-quartile 3). For the reciprocal reaction time in the PVT, the wilcoxon signed-rank tests testing for differences between S1 and S2 (Z = –1.65, p = .1) and between S2 and S3 (–1.73, p = .084) were non-significant.
Table 2
Subjective sleep quality for the night before the experimental sessions.
| BASELINE (S1) | CPAP TRIAL (S2) | FOLLOW-UP (S3) | S2–S1 | S3–S1 | |
|---|---|---|---|---|---|
| M (SD =) | M (SD =) | M (SD =) | |||
| Sleep depth | 4.09 (.33) | 4.63(.35) | 6.42 (.47) | Δ = .55; p = .18 | Δ = 2.33; p < .001 |
| Sleep quality | 2.78 (.24) | 3.25 (.25) | 4.97 (.35) | Δ = .47; p = .16 | Δ = 2.18; p < .001 |
| Sleep satisfaction | 2.44 (.23) | 3.12 (.24) | 4.01 (.33) | Δ = .68; p = .03 | Δ = 1.57; p < .001 |
| Nocturnal awakenings | 2.78 (.35) | 2.70 (.36) | .51 (.48) | Δ = –.09; p = .82 | Δ = –2.28; p < .001 |
| Perceived difficulty of falling asleep | 1.83 (.15) | 2.04 (.16) | .84 (.21) | Δ = .21; p = .26 | Δ = –.99; p < .001 |
[i] Note: Subjective Sleep quality (Ellis et al., 1981) mean (standard deviation) values for the nights preceding the verbal learning sessions, and between-sessions comparison statistics. Δ: differential score between sessions.
Table 3
Polysomnographic parameters at Baseline (S1) and CPAP trial (S2) nights.
| BASELINE | CPAP TRIAL | BASELINE VS. CPAP TRIAL NIGHT | DIRECTIONALITY | |
|---|---|---|---|---|
| M (SD) | M (SD) | F, P | ||
| TIB | 515.75 (7.47) | 510.26 (7.47) | F(1,22) = .83 p = .37 | S1 = S2 |
| TST | 357.41 (15.93) | 346.94 (15.93) | F(1,22) = .39 p = .54 | S1 = S2 |
| SPT | 424.33 (15.43) | 411.74 (15.43) | F(1,22) = .74 p = .4 | S1 = S2 |
| Sleep efficiency | 68.95 (2.55) | 67.7 (2.55) | F(1,22) = .20 p = .66 | S1 = S2 |
| Total number of Arousals | 241.59 (15.86) | 113.68 (15.86) | F(1,21) = 57.96 p < .01 | S1 > S2 |
| Snore (%) | 36.51 (4.10) | 11.26 (4.10) | F(1,22) = 33.06 p < .01 | S1 > S2 |
| N1 (%) | 18.25 (1.99) | 13.97 (1.99) | F(1,22) = 4.23 p = .05 | S1 > S2 |
| N2 (%) | 52.10 (2.83) | 48.33 (2.83) | F(1,22) = 1.25 p = .28 | S1 = S2 |
| N3 (%) | 17.08 (2.25) | 19.99 (2.25) | F(1,22) = 1.23 p = .28 | S1 = S2 |
| REM (%) | 12.57 (1.19) | 17.72 (1.19) | F(1,22) = 16.93 p < .01 | S1 < S2 |
| AHI (/h) | 39.9 (3.08) | 10.14 (3.08) | F(1,22) = 73.53 p < .01 | S1 > S2 |
| AHI REM (/h) | 33.74 (3.30) | 6.97 (3.30) | F(1,22) = 38.62 p < .01 | S1 > S2 |
| AHI NREM (/h) | 40.44 (3.33) | 10.95 (3.33) | F(1,22) = 63.78 p < .01 | S1 > S2 |
| OAHI (/h) | 37.31 (3.13) | 8.26 (3.13) | F(1,21) = 66.10 p < .01 | S1 > S2 |
| RDI (/h) | 45.1 (3.02) | 12.19 (3.02) | F(1,21) = 99.59 p < .01 | S1 > S2 |
| RDI REM (/h) | 37.54 (3.46) | 8.39 (3.46) | F(1,22) = 37.66 p < .01 | S1 > S2 |
| RDI NREM (/h) | 45.60 (3.12) | 13.17 (3.12) | F(1,22) = 95.93 p < .01 | S1 > S2 |
| ODI (/h) | 27.06 (3.53) | 7.02 (3.53) | F(1,22) = 28.58 p < .01 | S1 > S2 |
| Mean Saturation | 27.05 (3.53) | 7.02 (3.53) | F(1,22) = 28.58 p < .01 | S1 > S2 |
| ArI Total | 241.59 (15.89) | 113.68 (15.89) | F(1,21) = 57.96 p < .01 | S1 > S2 |
| ArI respiration | 27.52 (4.2) | 9.48 (4.2) | F(1,22) = 11.70 p = .02 | S1 > S2 |
| ArI Desaturation | 96.87 (10.59) | 15.65 (10.59) | F(1,22) = 42.76 p < .01 | S1 > S2 |
[i] Note: TIB = time in bed; TST = total sleep time; SPT = sleep period time; N1(%) = proportion (%) sleep stage N1 on TST; N2(%) = % sleep stage N2; N3(%) = % sleep stage N3; REM (%) = % sleep stage REM; AHI = apnoea and hypopnea index; AHI REM = apnoea and hypopnea index during REM stage; AHI NREM = apnoea and hypopnea index during Non-REM stages; OAHI = obstructive apnoea and hypopnea index; RDI = respiratory disturbance index; RDI REM = respiratory disturbance index during REM stage; RDI NREM = respiratory disturbance index during Non-REM stages; ODI = oxygen desaturation index; ArI total = total arousals index; ArI respiration = respiratory related arousals index; ArI desaturation = desaturation related arousals index. Directionality in the last column indicates the direction of the differences between Baseline and CPAP trial nights, with S1 = S2 meaning no statistically significant differences.
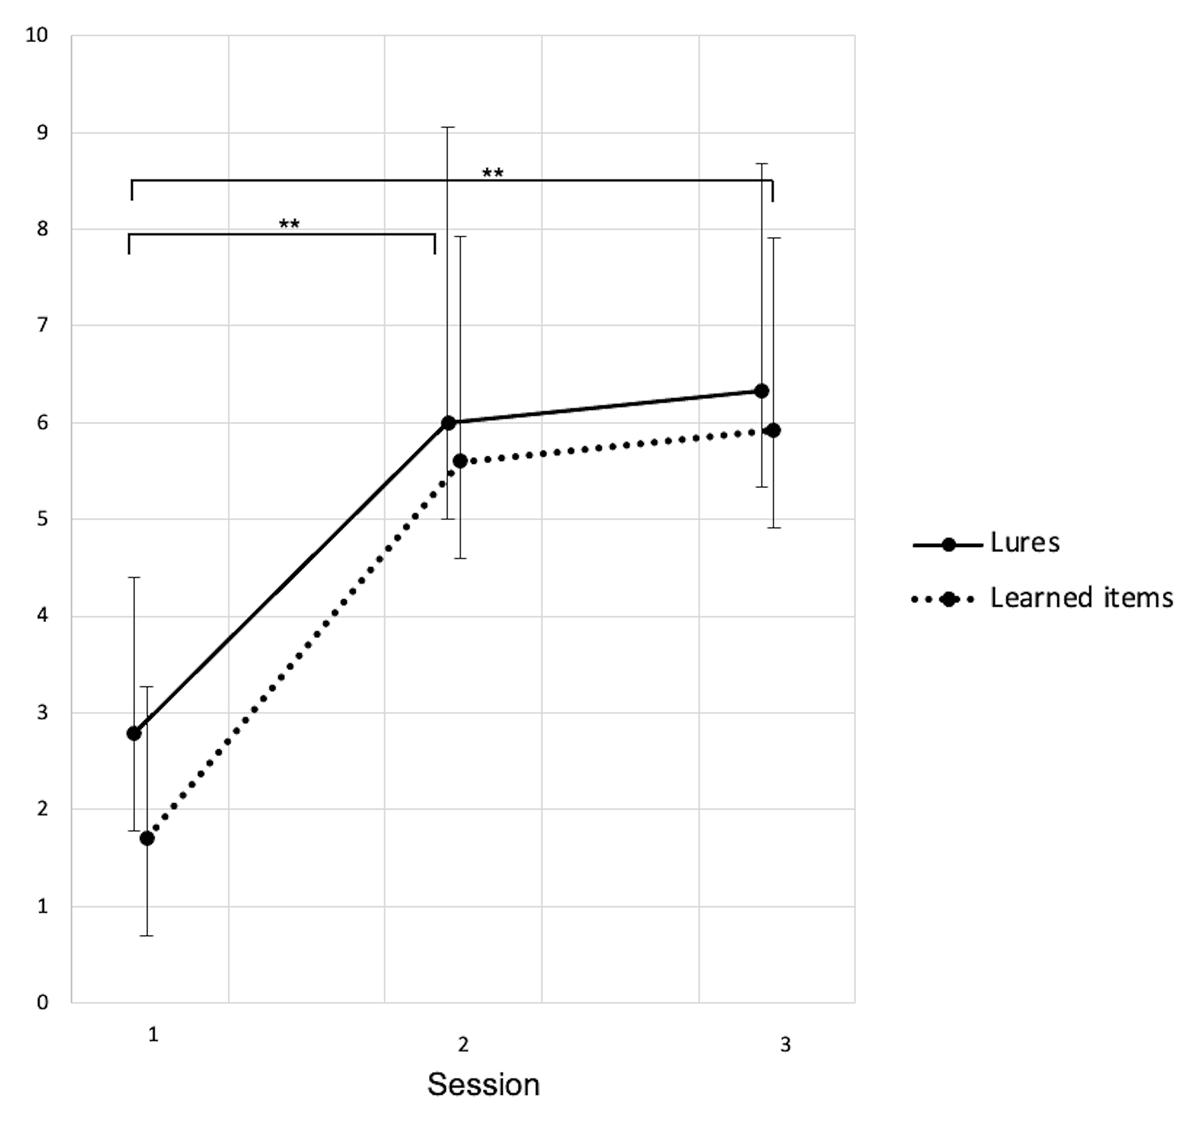
Figure 1
Recognition score (number of words endorsed) for learned words and lures.
Session 1: Baseline, Session 2: After CPAP-trial, Session 3: Follow-up. Data shown as mean ± standard deviations. S1–S2: 23 participants. S3: 12 participants. * p < .05, ** p < .01.
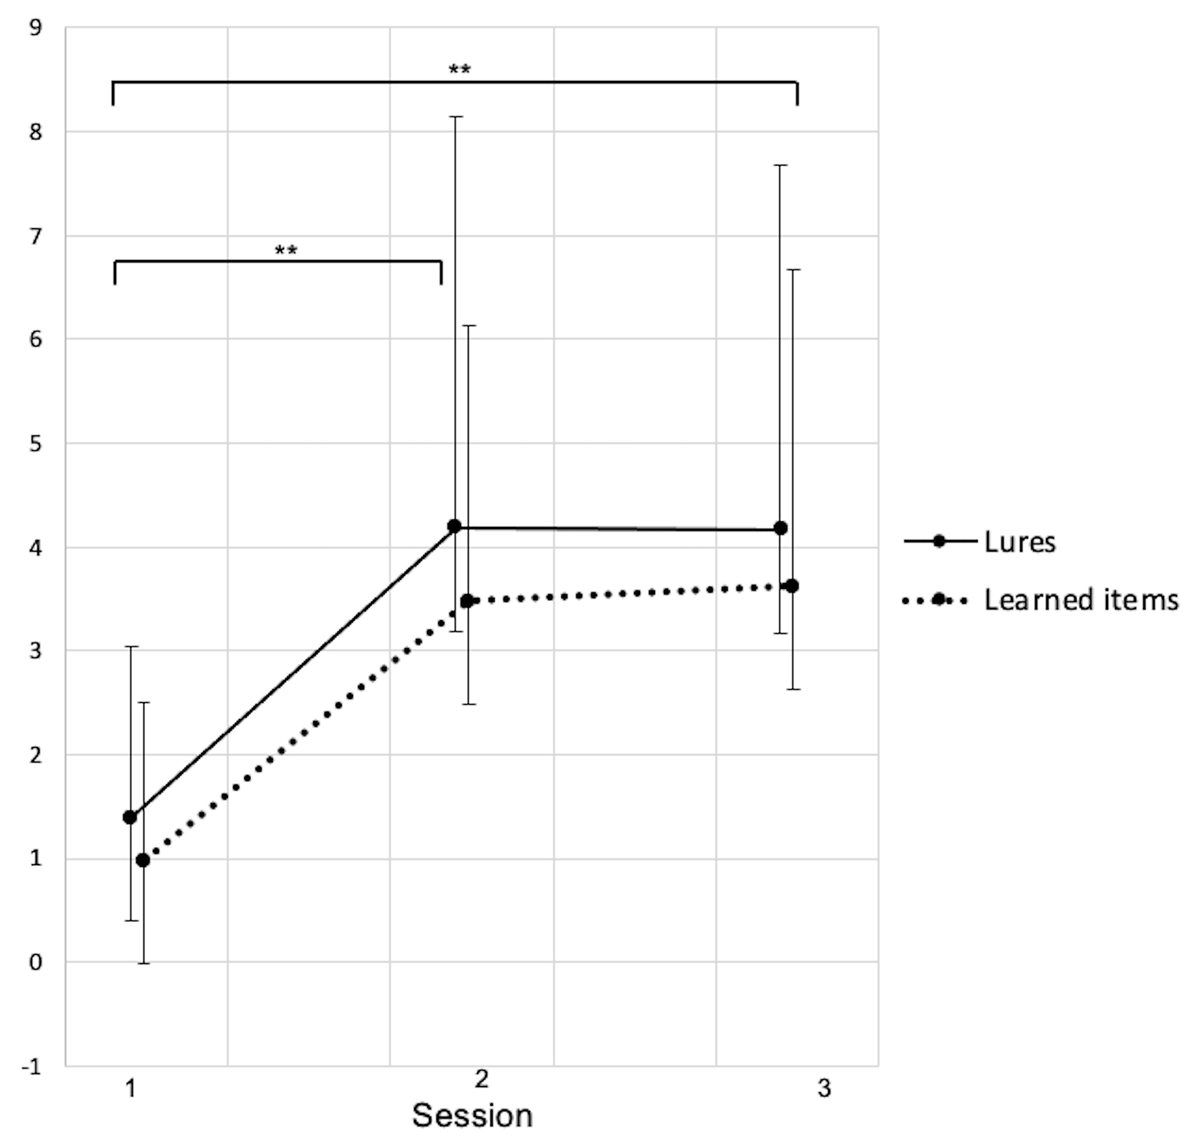
Figure 2
Recognition score (number of words endorsed) for learned words and lures for which the recognition was based on a clear memory of the studied word (Remember).
Session 1: Baseline, Session 2: After CPAP-trial, Session 3: Follow-up. Data shown as mean ± standard deviations. S1–S2: 23 participants. S3: 12 participants. * p < .05, ** p < .01.
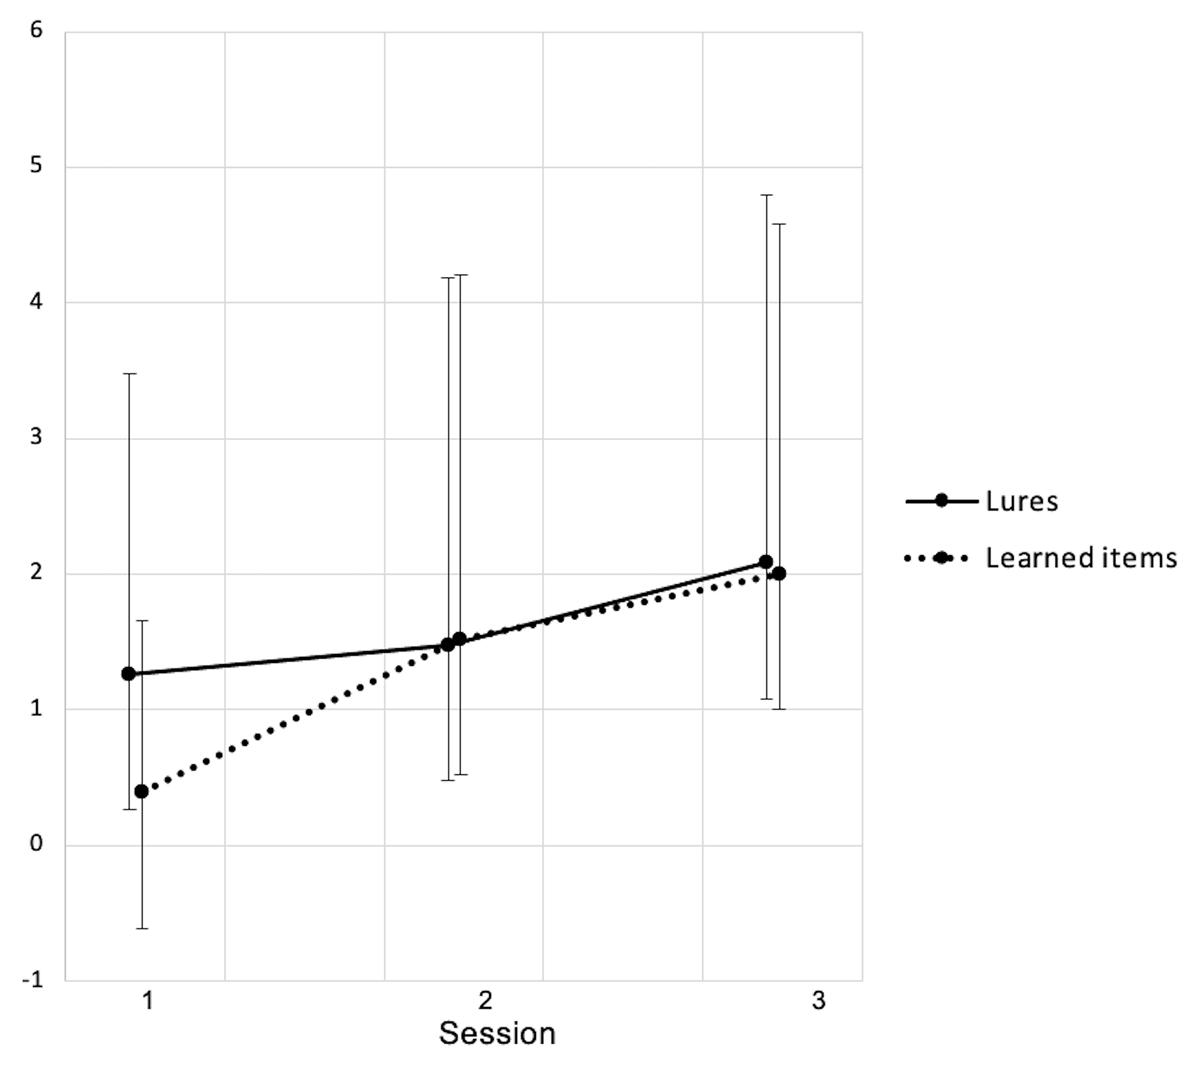
Figure 3
Recognition score (number of words endorsed) for learned words and lures for which the recognition was based on a feeling of familiarity about the word (Know).
Session 1: Baseline, Session 2: After CPAP-trial, Session 3: Follow-up. Data shown as mean ± standard deviations. S1– S2: 23 participants. S3: 12 participants. * p < .05, ** p < .01.
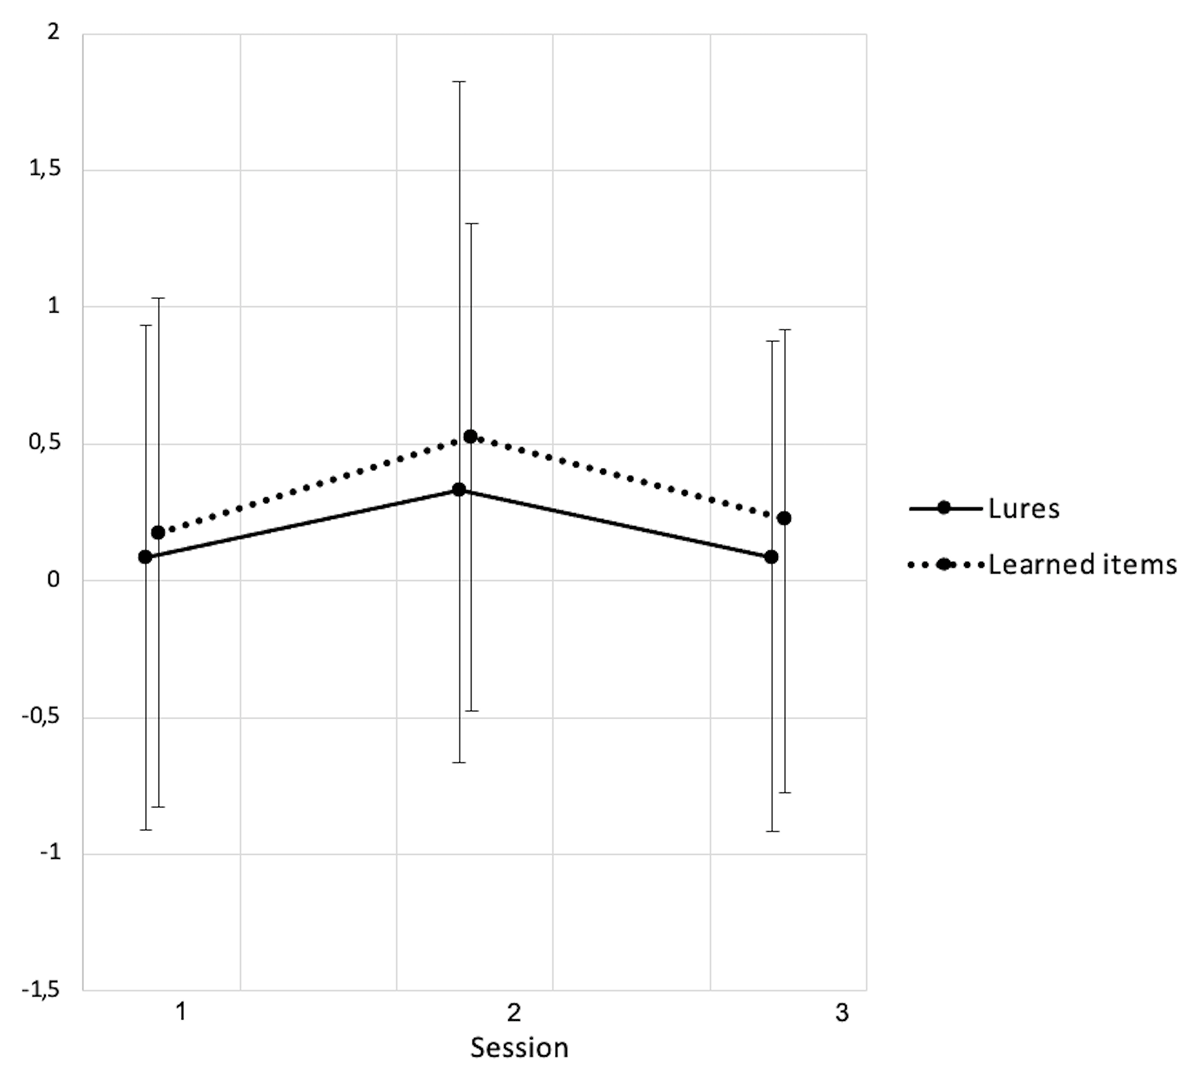
Figure 4
Recognition score (number of words endorsed) for learned words and lures for which the recognition was at random (Guess).
Session 1: Baseline, Session 2: After CPAP-trial, Session 3: Follow-up. Data shown as mean ± standard deviations. S1–S2: 23 participants. S3: 12 participants. * p < .05, ** p < .01.