
Table 1
Summary of all participant characteristics.
| INFORMATION | PATIENT 1 | PATIENT 2 | PATIENT 3 | PATIENT 4 |
|---|---|---|---|---|
| Baseline information | ||||
| Gender | Female | Female | Female | Female |
| Age | 58 | 20 | 30 | 48 |
| Intake diagnoses | Bipolar disorder (Type II) | Major depressive disorder | Major depressive disorder | Burn-out |
| Panic disorder with agoraphobia | Panic disorder with agoraphobia | Panic disorder with agoraphobia | Somatization-related complaints | |
| Substance abuse (remitted) | ||||
| Borderline personality disorder | ||||
| ESM information | ||||
| Days of ESM since intake | 464 | 406 | 393 | 393 |
| Number of items | 14 | 16 | 16 | 12 |
| Waking hours | 9AM–8PM | 8AM–9PM | 8.30AM–9PM | 8AM–8PM |
| Compliance | 60.09% | 40.00% | 82.68% | 46.71% |
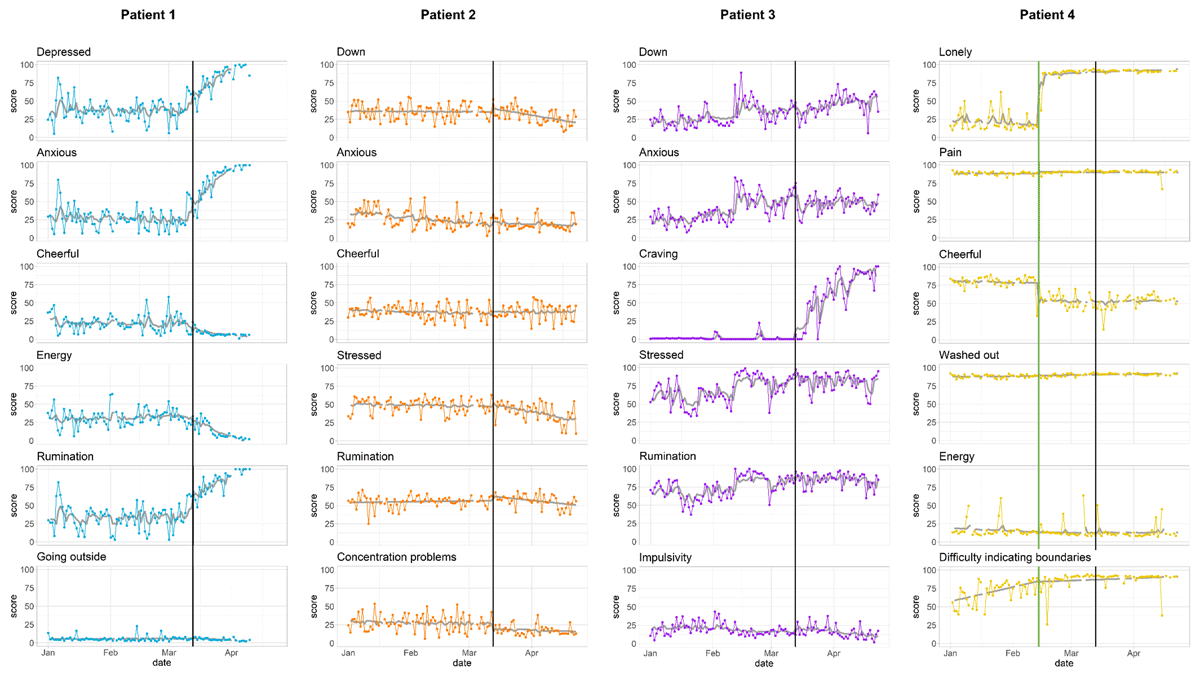
Figure 1
Different mood and symptom trajectories in response to the Belgian COVID-19 lockdown measures. Panel A depicts six case-representative symptoms or emotions for each subject. All momentary states are rated on continuous slider scales ranging from 0 (not at all) to 100 (very much). In all graphs, the colored line represents the original time series data (averaged per day to get an indication of daily emotion and symptom fluctuations); the grey line shows the model-based predicted time-series, allowing to assess model fit. The black vertical line denotes the beginning of the lockdown period (issued on March 13th). For Patient 4, the green line depicts a self-reported family conflict (February 14th).
Table 2
Summary of all piecewise regression models.
| PATIENT 1 | PATIENT 2 | PATIENT 3 | PATIENT 4 | ||||||||||||||||
|---|---|---|---|---|---|---|---|---|---|---|---|---|---|---|---|---|---|---|---|
| Items | βe | βd | βe*d | βl | Items | βe | βd | βe*d | βl | Items | βe | βd | βe*d | βl | Items | βe | βd | βe*d | βl |
| Depressive features | |||||||||||||||||||
| Depressed | 13.97 | 0.00 | 1.33* | 0.31* | Down | 4.49 | –0.01 | –0.44 | 0.03 | Down | –3.62 | 0.20* | 0.07 | 0.36*** | |||||
| Sad | 12.47 | –0.09 | 0.19 | 0.29* | Guilt | 3.96 | –0.11 | 0.07 | –0.04 | Frustrated | 9.23 | 0.03 | 0.08 | 0.31** | Anger | –0.49 | 0.12 | –0.05 | 0.09 |
| Cheerful | –5.32 | –0.02 | –0.24 | 0.32* | Cheerful | 2.87 | –0.08 | 0.08 | –0.11 | Cheerful | –2.18 | –0.07 | 0.06 | 0.51*** | Cheerful | –20.71** | –0.08 | 0.08 | 0.13 |
| Anhedonia | 12.98 | –0.11 | 0.79 | 0.37* | Anhedonia | 2.86 | 0.10 | –0.10 | 0.38*** | ||||||||||
| Self-esteem | –4.93 | –0.02 | –0.38 | 0.33* | Self-esteem | –1.37 | 0.03 | –0.14 | –0.10 | Self-esteem | –3.80 | –0.05 | 0.01 | 0.31** | |||||
| Rumination | 19.21* | 0.03 | 0.92 | 0.33* | Rumination | 5.76 | 0.04 | –0.32 | 0.00 | Rumination | 0.90 | 0.17* | –0.24 | 0.49*** | |||||
| Suppression | 13.95 | 0.11 | 0.50 | 0.41** | Suppression | 2.00 | –0.10 | 0.14 | –0.02 | Suppression | –8.33 | 0.23* | 0.04 | 0.55*** | |||||
| Energy | –5.26 | 0.05 | –0.93* | 0.22 | Tired | 0.19 | –0.04 | –0.19 | 0.08 | Energy | –1.33 | –0.06 | 0.05 | 0.52*** | Energy | –0.51 | –0.13 | 0.13 | 0.15 |
| Conc. problems | –4.58 | –0.02 | 0.87** | 0.56*** | Conc. problems | –8.20 | –0.04 | –0.06 | –0.14 | Conc. problems | 0.75 | 0.15* | –0.24 | 0.45*** | Conc. problems | 1.25 | 0.03 | –0.03 | 0.17 |
| Social pressure | 14.14* | 0.00 | –0.95* | 0.88*** | Unease | –0.93 | –0.06 | 0.06 | 0.12 | ||||||||||
| Anxiety features | |||||||||||||||||||
| Anxious | 17.91* | –0.04 | 1.79** | 0.28* | Anxious | 2.62 | –0.21 | 0.14 | 0.16 | Anxious | –7.79 | 0.30** | –0.21 | 0.45*** | |||||
| Stressed | 12.19 | –0.03 | 2.70*** | –0.01 | Stressed | 2.09 | –0.04 | –0.43 | 0.11 | Stressed | –0.66 | 0.19* | –0.22 | 0.52*** | |||||
| Relaxed | –8.16 | –0.02 | –0.61 | 0.18 | Relaxed | –1.11 | 0.05 | 0.01 | 0.05 | Relaxed | –2.19 | –0.13* | 0.05 | 0.31** | Relaxed | –14.61* | –0.02 | –0.12 | 0.11 |
| Going outside | 0.69 | 0.01 | –0.18 | –0.16 | Crowded | –3.22 | –0.07 | 0.09 | 0.04 | Crowded | 2.17 | 0.13 | –0.05 | 0.06 | |||||
| Hyperventilation | 0.60 | –0.08 | 0.20 | –0.05 | |||||||||||||||
| Restless | –3.34 | –0.05 | 0.15 | 0.06 | |||||||||||||||
| Borderline features | |||||||||||||||||||
| Paranoia | 0.68 | –0.07 | 0.13 | 0.15 | Fear abandonment | 7.68 | 0.17** | –0.32* | 0.16 | Diff. being alone | 38.61*** | –0.08 | 0.19 | 0.37** | |||||
| Impulsivity | 4.80 | –0.09 | –0.13 | 0.23* | Lonely | 48.56*** | –0.14 | 0.24 | 0.28** | ||||||||||
| Good relations | –4.41 | –0.15 | 0.01 | 0.44*** | |||||||||||||||
| Substance abuse | |||||||||||||||||||
| Craving | 10.96* | 0.00 | 1.05*** | 0.49*** | |||||||||||||||
| Somatization and burn-out features | |||||||||||||||||||
| Pain | 2.29 | –0.01 | 0.00 | –0.03 | |||||||||||||||
| Washed-out | 0.43 | 0.03 | 0.02 | 0.09 | |||||||||||||||
| Empty | 1.47 | 0.00 | 0.05 | –0.03 | |||||||||||||||
| Diff. saying no | Diff. indic. bound. | –1.06 | 0.64** | –0.54* | –0.01 | ||||||||||||||
[i] Note. βe, βd, βe*d, βl denote the event effect (lockdown for Patient 1 to 3 or family conflict for Patient 4), day trend before the event (with day centered around the event), the interaction between event and day predictors, and a lagged version of the modeled feature that refers to the previous day (to take into account serial dependencies), respectively. For each participant, we controlled for multiple testing using the false discovery procedure by Benjamini and Hochberg (1995). *p < .05, **p < .01, ***p < .001.