
Table 1
Number of participants who have engaged in different methods of NSSI.
| NSSI method | Total community sample | Female community sample | Male community sample | Female patient sample | ||||
|---|---|---|---|---|---|---|---|---|
| N = 254 | n = 124 | n = 130 | N = 60 | |||||
| Cutting | 3.1% | 8 | 4.8% | 6 | 1.5% | 2 | 13.3% | 8 |
| Burning | 0.0% | 0 | 0.0% | 0 | 0.0% | 0 | 1.7% | 1 |
| Hitting | 3.9% | 10 | 4.0% | 5 | 3.8% | 5 | 23.3% | 14 |
| Head banging | 9.8% | 25 | 8.1% | 10 | 11.5% | 15 | 18.3% | 11 |
| Scratching | 2.4% | 6 | 4.0% | 5 | 0.8% | 1 | 18.3% | 11 |
[i] Note: Within group percentages are given. NSSI, non-suicidal self-injury.
Table 2
Correlations between NSSI, PB, temperamental characteristics, and age.
| Female community sample | Male community sample | Female patient sample | ||||
|---|---|---|---|---|---|---|
| NSSI | PB | NSSI | PB | NSSI | PB | |
| NSSI | 1.00 | 0.33*** | 1.00 | –0.08 | 1.00 | –0.11 |
| PB | 0.33*** | 1.00 | –0.08 | 1.00 | –0.11 | 1.00 |
| BIS | 0.17 | 0.18* | 0.09 | 0.08 | 0.22 | –0.04 |
| BAS | 0.04 | 0.28** | 0.00 | 0.11 | –0.19 | 0.17 |
| EC | –0.20* | –0.41*** | –0.27** | –0.28** | 0.09 | –0.43*** |
| Age | –0.33*** | –0.15 | –0.31*** | –0.13 | 0.00 | –0.13 |
[i] Note: Associations between NSSI (0/1) and dimensional PB scores/temperament were calculated by means of Spearman correlation coefficients, whereas associations between the dimensional PB scores and temperament were calculated by means of Pearson correlation coefficients. NSSI, non-suicidal self-injury; PB, pathological buying; BIS, behavioural inhibition system; BAS, behavioural activation system; EC, effortful control.
*p < .05. **p < .01 ***p < .001.
Table 3
Prediction of NSSI based on reactivity and effortful control and their interactions, controlled for age.
| Step | Variables in regression | Female community sample | Male community sample | Female patient sample | |||
|---|---|---|---|---|---|---|---|
| B | Nagelkerke R2 | B | Nagelkerke R2 | B | Nagelkerke R2 | ||
| Step 1 | Age | –0.96** | 0.16 | –1.21** | 0.21 | –0.15 | 0.01 |
| Step 2 | Age | –0.80* | –1.19** | –0.32 | |||
| BIS | 0.54 | 0.40 | 0.50 | ||||
| BAS | –0.36 | –0.39 | –0.63 | ||||
| EC | –0.47 | 0.22 | –0.51 | 0.29 | –0.04 | 0.14 | |
| Step 3 | Age | –0.88* | –1.27** | –0.47 | |||
| BIS | 0.51 | 0.28 | 0.58 | ||||
| BAS | –0.40 | –0.06 | –0.81* | ||||
| EC | –0.58 | –0.86 | –0.17 | ||||
| BIS*EC | 0.03 | –0.11 | 0.493 | ||||
| BAS*EC | –0.52 | 0.27 | 1.11* | 0.35 | –0.632 | 0.28 | |
[i] Note: NSSI, non-suicidal self-injury; BIS, behavioural inhibition system; BAS, behavioural activation system; EC, effortful control.
* p < .05. **p < .01.
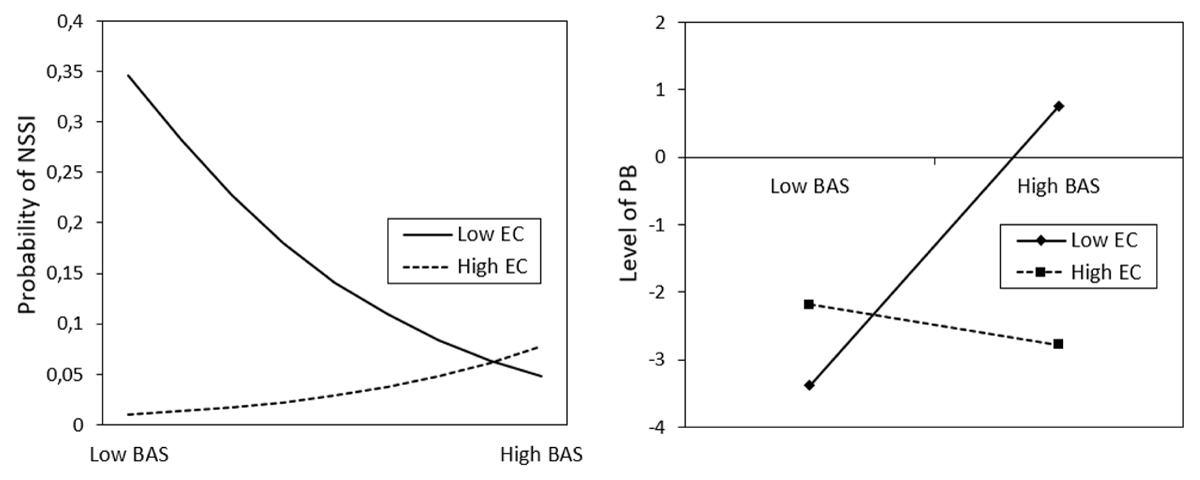
Figure 1
Interaction between BAS and effortful control in the prediction of NSSI for community men and in the prediction of PB for community women. NSSI; non-suicidal self-injury; PB, pathological buying; BAS, behavioural activation system; EC, effortful control.
Table 4
Prediction of PB based on reactivity and effortful control and their interactions, controlled for age.
| Step | Variables in regression | Female community sample | Male community sample | Female patient sample | |||
|---|---|---|---|---|---|---|---|
| B | R2 | B | R2 | β | R2 | ||
| Step 1 | Age | –0.14 | 0.02 | –0.09 | 0.01 | –0.12 | 0.02 |
| Step 2 | Age | 0.05 | 0.04 | –0.01 | |||
| BIS | 0.13 | –0.01 | –0.03 | ||||
| BAS | 0.18* | 0.05 | 0.12 | ||||
| EC | –0.37** | 0.23** | –0.27* | 0.07 | –0.44** | 0.23** | |
| Step 3 | Age | 0.05 | 0.06 | 0.01 | |||
| BIS | 0.12 | –0.02 | –0.04 | ||||
| BAS | 0.20* | 0.04 | 0.12 | ||||
| EC | –0.36** | –0.38* | –0.42* | ||||
| BIS*EC | –0.00 | –0.14 | –0.16 | ||||
| BAS*EC | –0.24** | 0.28* | 0.11 | 0.10 | 0.11 | 0.26 | |
[i] Note: PB, pathological buying; BIS, behavioural inhibition system; BAS, behavioural activation system; EC, effortful control.
* p < .05. **p < .01.