
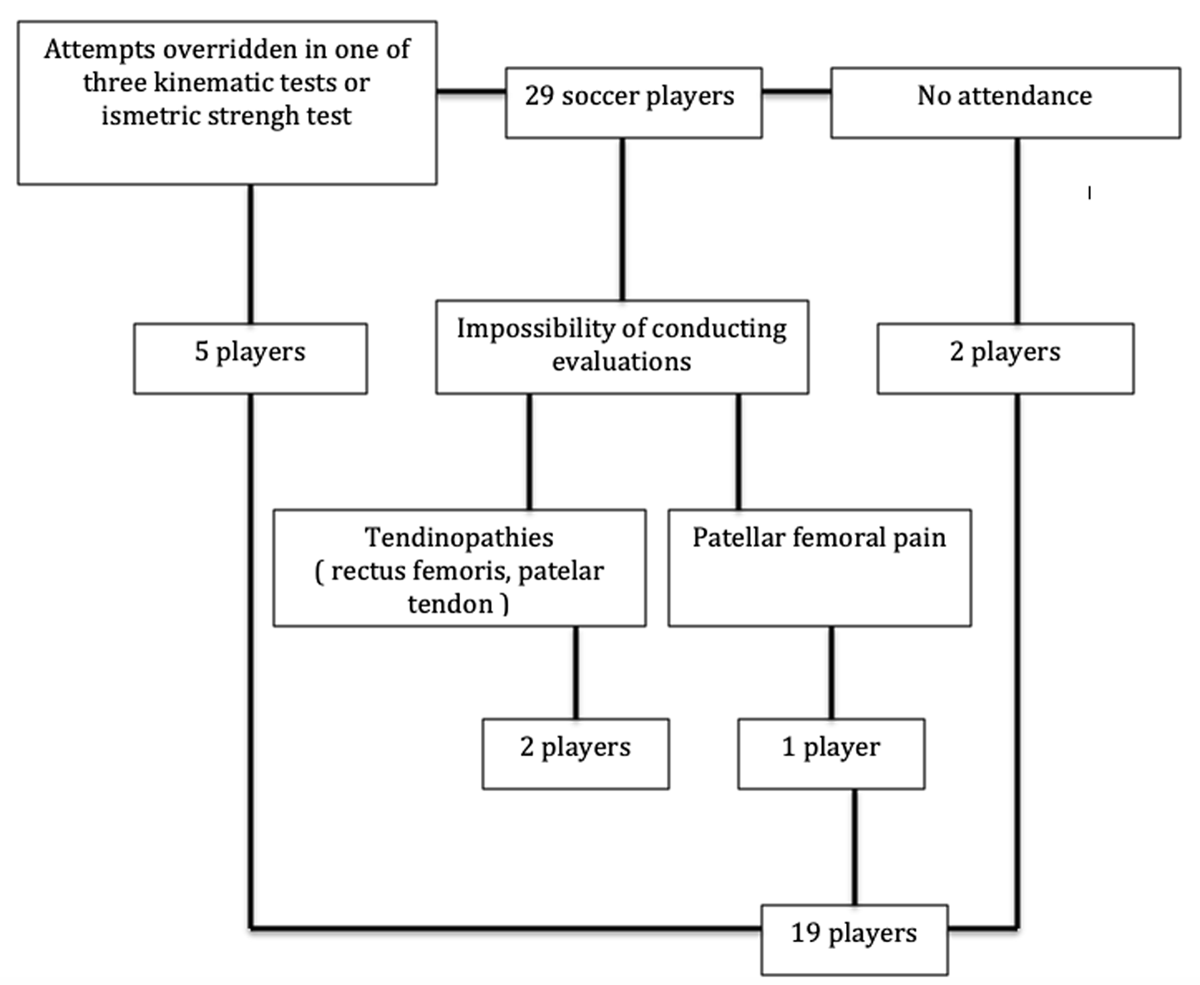
Figure 1
Player recruitment flowchart.
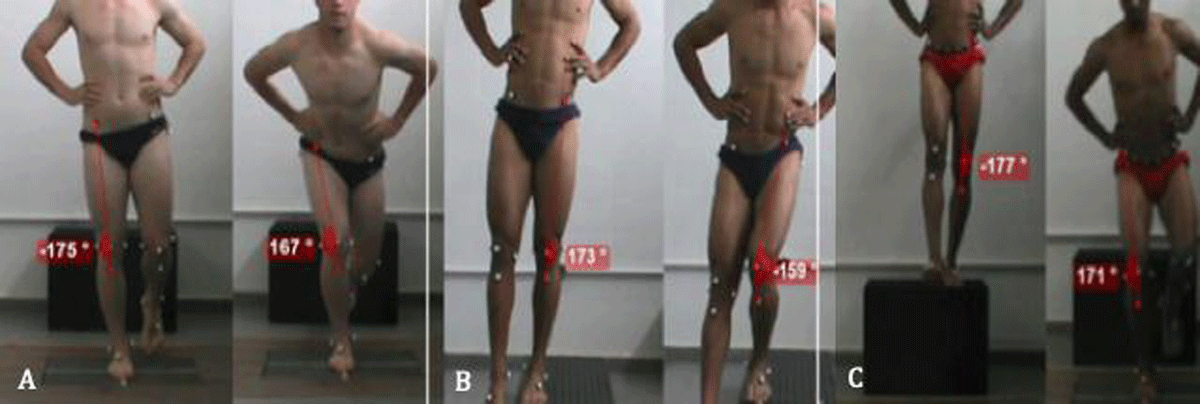
Figure 2
A. Single Limb Squat Test B. Side Step Down Test C. Single Leg Drop Landing Test. Source: the authors.
Table 1
Correlation between kinematic tests.
| Initial Left | Final Left | Initial Right | Final Right | ||||||||||
|---|---|---|---|---|---|---|---|---|---|---|---|---|---|
| A | B | C | A | B | C | A | B | C | A | B | C | ||
| A | Pearson’s correlation | 1 | 0,245 | 0,69* | 1 | 0,46* | 0,53* | 1 | 0,291 | 0,66* | 1 | 0,179 | 0,453 |
| Significance | 0,313 | 0,001 | 0,045 | 0,020 | 0,095 | 0,002 | 0,464 | 0,51 | |||||
| B | Pearson’s correlation | 0,245 | 1 | 0,136 | 0,46* | 1 | –0,01 | 0,291 | 1 | 0,394 | 0,179 | 1 | –0,01 |
| Significance | 0313 | 0,580 | 0,045 | 0,981 | 0,095 | 0,95 | 0,464 | 0,984 | |||||
| C | Pearson’s correlation | 0,69* | 0,136 | 1 | 0,53* | –0,01 | 1 | 0,66* | 0,394 | 1 | 0,453 | –0,01 | 1 |
| Significance | 0,001 | 0,580 | 0,020 | 0,981 | 0,002 | 0,95 | 0,51 | 0,984 | |||||