
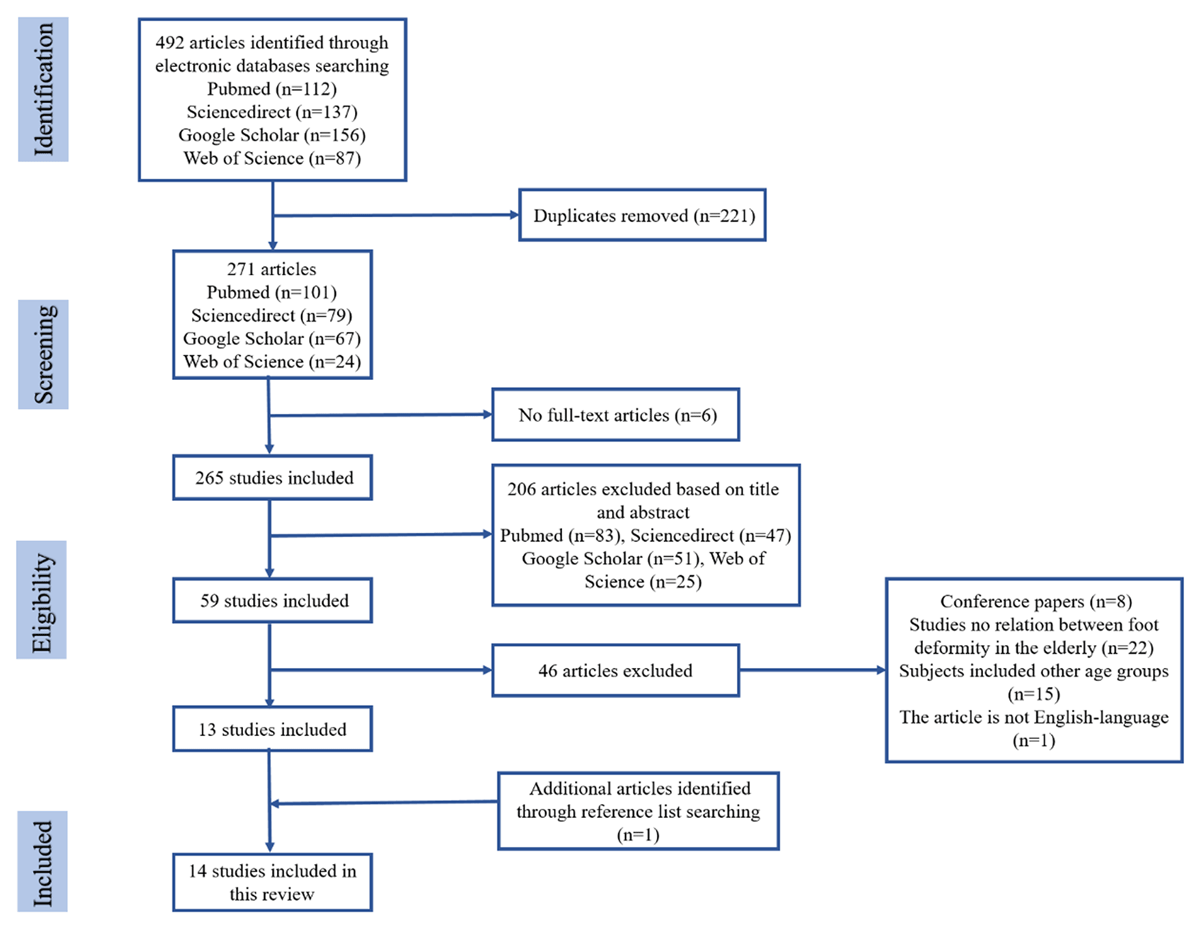
Figure 1
The flowchart of literature searching and screening.
Table 1
The summerization of study characteristics.
| Study | Foot deformity type | Study population | Study design | Plantar pressure | Conclusion |
|---|---|---|---|---|---|
| Menz et al. (2007) | Plantarhyperkeratotic lesions | 292 subjects (99 men and 193 women) aged 62–96 years(mean aged 77.6 ± 6.9) | comparisons were made between calluses and non-callused areas of the foot. | Those with calluses at the second, third through fifth metatarsophalangeal joints and the big toe had significantly higher pressure spikes on the soles of the feet than those without calluses. | Plantar pressures are significantly greater under callused areas of the foot in elderly. |
| Hagedorn et al. (2013) | Hallux Valgus Hammer Toes Morton’s Neuroma Overlapping Toes Tailor’s Bunion Plantar Fasciitis Hallux Rigidus Claw Toes | Data were from the Framingham foot study, mean age 66.2 ± 10.5 years | The subgroups of foot posture and function were established by using the improved arch index and the pressure deviation center index of the plantar pressure scan. | In the elderly, hallux valgus patients had a significantly increased incidence of bunions and overlapping toes, while hallux valgus patients had a significantly reduced incidence of bunions and stiffness. | Foot function are connected with the presence of certain foot diseases. |
| Menz et al. (2005) | Hallux valgus Lesser toe deformities Corns on toes Plantar calluses | 172 older people (53 men, 119 women) aged 62–96 years (mean age 80.0 ± 6.4 years) | Subjects completed tests of foot posture, range of motion, strength, sensation and toe deformity using a floor-mounted resistive sensor mat system. | Maximum force and stress in most areas of the foot is explained by differences in body weight. | The structural foot and ankle joint characteristics determined from clinical measurements can explain some key aspects of the plantar load pattern of the foot. |
| Menz et al. (2005) | Hallux valgus | 71 people (24 men, 47 women) between 75 and 93 (mean 80± 4) years of age | Temporal spatial parameters of the gait and acceleration patterns of the head and pelvis of 71 individuals walking on a flat surface and a specially designed irregular sidewalk. | Subjects with more severe hallux valgus showed a decrease in walking speed and step length, which was more pronounced on irregular surfaces. | Valgus has significant adverse effects on gait patterns in older adults and may lead to instability and risk of falls, especially when walking on irregular terrain. |
| Mickleet al. (2011) | Hallux valgus and lesser toe deformities | A total of 312 men and women over the age of 60 were randomly selected as study participants. | The spatiotemporal parameters, postural sway and dynamic plantar pressure distribution of the subjects were measured. | In older patients with bunion (n = 36) and with little toe deformity (n = 71), plantar anterior pressure patterns changed. | Toe deformity changes the pressure distribution on the soles of the feet when walking. |
| Mohd Said et al.(2016) | Pronated foot supinated foot | 50 older persons (mean 69.98 ± 5.84) form community-dwelling | Foot pressure (max P) and contact area were analyzed by using Footscan@ Rsscan platform. | The peak of plantar pressure in the forefoot area of all foot types was significantly different, and the peak of plantar pressure in the pronated foot was significantly lower than that in the supinated foot. | The type of foot affected the maximum pressure on the soles of the elderly and the functional reach distance showed some association. |
| Tuna et al. (2014) | Pronated foot | 10 healthy elderly with valgus (age 67.1± 5.5 years) and 16 healthy elderly with normal valgus (age 67.1± 5.9 years). | Kistler force plate was used to measure the static balance of two limbs standing in four shoe wearing situations. | There was no significant difference in the orthodontic effect between the four types of orthodontic devices. | The balance of pronated foot types tends to be unstable, but this is not significant. The use of orthotics had no effect on balance parameters, including eliminating the effects of eye closure. |
| Tong et al. (2011) | Type 2 Diabetes Mellitus | 35 patients (mean 64.6± 10.5) with type 2 diabetes and 38 patients (mean 48.9± 5.3) without tactile or foot deformity. | The plantar pressure of the subjects was measured. | The mean pressure-time integrals of the right foot of diabetic patients was significantly higher than that of normal people. | Changes in plantar pressure in diabetic patients may occur prior to the establishment of peripheral motor and sensory neuropathy. |
| Fernando et al. (2016) | Type 2 Diabetes Mellitus | 21 cases with diabetic foot ulcers aged between 52 and 72 years (mean 66), 69 diabetes controls aged between 58 and 72 years (mean 63) and 56 healthy controls aged between 55 and 73 years (mean 56) | A pre-established method was used to measure plantar pressure at 10 sites and the duration of the standing phase. | Most ulcers are on the big toe and the sole of the toe. The mean peak plantar pressure and toe pressure-time score, as well as the midfoot score, were significantly increased in patients with foot ulcers. | In the case of higher plantar pressure, patients with diabetic foot ulcers are expected to reduce plantar pressure despite having a longer standing period. |
| Bus et al. (2004) | Diabetic | 20 diabetic patients (13 men, 7 women) aged mean 64.4± 11.2 with neuropathy and foot deformity | Peak local in-shoe pressure and force-time integrals were measured when the subjects walked in flat shoes or custom insoles. | Custom-made insoles showed smaller peak pressures and force-time integrals in the heel and first metatarsal head regions. | Custom-made insoles were more effective than flat insoles in off-loading the first metatarsal head region, but with considerable variability between individuals. |
| YU et al. (2011) | Diabetic Toe Deformity | 30 patients (15 males and 15 females) mean aged 56.2± 8.3 years with diabetic claw or hammer toe deformity and 30 healthy patients (15 males and 15 females) with an age of 57.9± 7.1 years | Foot pressure was measured in different areas of the foot using the f-scan® dynamic foot pressure analysis system. | The peak pressure of the big toe and the first to fifth metatarsal bone in the patient group was significantly higher than that in the control group, and the peak pressure of the posterior foot in the patient group was significantly lower than that in the control group. | Diabetics with malformed toes have abnormally high levels of plantar pressure. |
| Tuna et al. (2014) | Type 2 Diabetes Mellitus | 43(27 women, 16 men; age: 63.5± 9.2 years old) diabetic foot disease course more than 10 years old; 41 patients (female: 23 males: 18; age 54.3± 11.5 years old) of disease was less than 10 years | Each subject was assessed in a static and dynamic pedographic manner. | Dynamic plantar pressure evaluation: in the first group, the peak pressure of phalangeal bone was significantly increased in the left foot, while the contact area of the right foot was lower. | In patients with type 2 diabetes over a 10-year course, the contact area during forefoot walking decreased and the peak pressure increased. |
| Ko et al. (2012) | Diabetes | 9 subjects (7 female, 2 male; age 68.7 ± 7.5) with diabetes and 9 (7 female, 2 male; age 72.3 ± 10.9) age gender matched group without diabetes | A steady walking speed, peak plantar pressure and the fore and rear foot (F/R) peak plantar pressure ratio and gait variables were measured during barefoot walking. | The walking speed of diabetic patients was significantly lower than that of the age and gender matched group, leading to a significant reduction in the peak plantar pressure of the front and rear feet during barefoot walking. | The diabetic group was significantly lower than the control group in the aspects of step frequency, step length, gait, step length, step frequency and toe in/out Angle. |
| Tang et al. (2014) | Type 1 and type 2 Diabetes Mellitus | 114 patients with type 1 (N = 31) or type 2 (N = 83) diabetes (62 men and 52 women; mean age, 57.7± 15.4 years; duration of diabetes, 12.3± 11.2 years; neuropathy, 38%) | the in-shoe plantar pressures were measured through using F-Scan@ at seven ROI (hallux, metatarsal head 1, 2, 4, 5, the foot side, heel) on five occasions. | Compared with prefabricated insoles, the peak pressure in the heel area of EVA insoles is significantly lower. There are also some differences in the other six ROI indicators. | In patients with diabetic foot ulcers, the insole maintains its pressure redistribution characteristics over a long period of time when the insole is used. |