
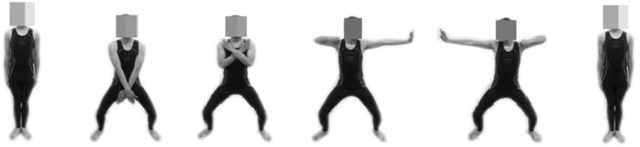
Figure 1
The movement is testing action (light and right open bow like shootout schematic).
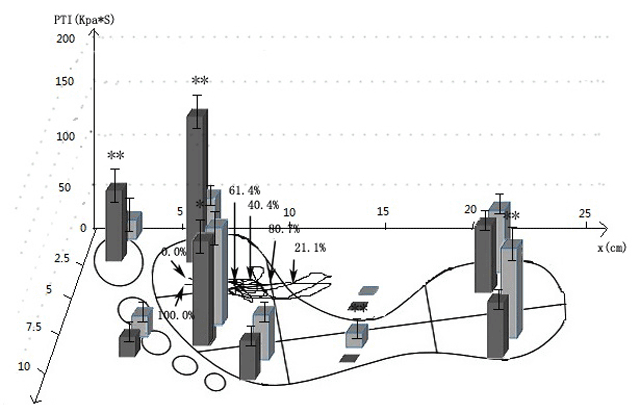
Figure 2
The COP trajectory time and PTI graphs. Comparison of PTI among 9 plantar regions during BDJ movements and NK. “**” indicates p < 0.01 compared with the NK, “*” indicates p < 0.05 compared with the NK.
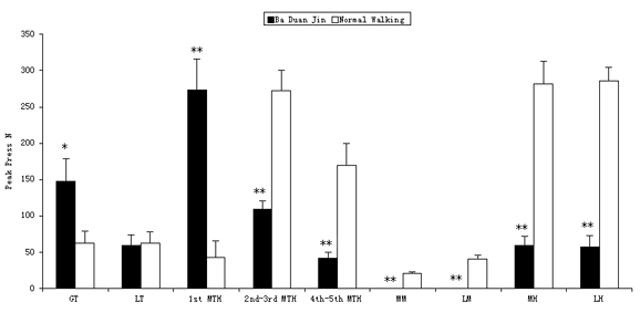
Figure 3
Comparison of PP among 9 plantar regions during BDJ movements and NK. “**” indicates p < 0.01 compared with the NK, “*” indicates p < 0.05 compared with the NK.
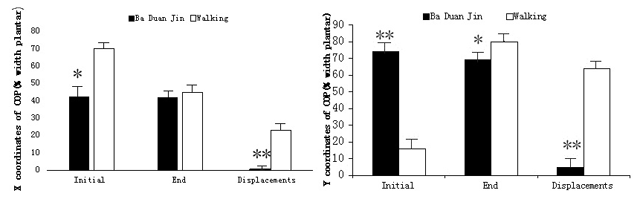
Figure 4
Comparisons of the X and Y coordinates of the COP at initial and end contact with the ground and the displacements during contact in the BDJ movements and NK. Values are mean ± SD. “**” significantly different than NK (p < 0.01), “*” significantly different than NK (p < 0.05).