
Table 1
Clinical characteristics of participants. Results are presented as mean (SD) for continuous variables or as percentage for categorical variables. P values are for the difference between south Asians and Europeans, calculated by regression analysis with adjustment for age and gender.
| Europeans | South Asians | p | |
|---|---|---|---|
| Age (years) | 52.0 (13.7) | 50.1 (12.6) | 0.2 |
| Male % | 55.5% | 60.5% | 0.3 |
| Type 2 Diabetes (%) | 5.7% | 12.8% | 0.01 |
| Hypertension (%) | 23.2.0% | 39.9% | 0.001 |
| CHD (%) | 6.7% | 15.8% | 0.006 |
| Smoking (%) | 42.1% | 24.1% | <0.001 |
| Height (cm) | 168.7 (10.8) | 164.7 (8.6) | 0.002 |
| Weight (cm) | 75.4 (17.0) | 75.2 (12.0) | 0.9 |
| Body mass index (kg/m2) | 27.0 (5.9) | 27.7 (3.9) | 0.5 |
| Waist circumference (cm) | 90.4 (13.9) | 94.4 (11.0) | 0.003 |
| Hip circumference (cm) | 103.7 (10.7) | 104.0 (8.4) | 0.8 |
| Waist hip ratio | 0.87 (0.07) | 0.91 (0.09) | <0.001 |
| Time on treadmill (minutes) | 9.3 | 8.0 | 0.01 |
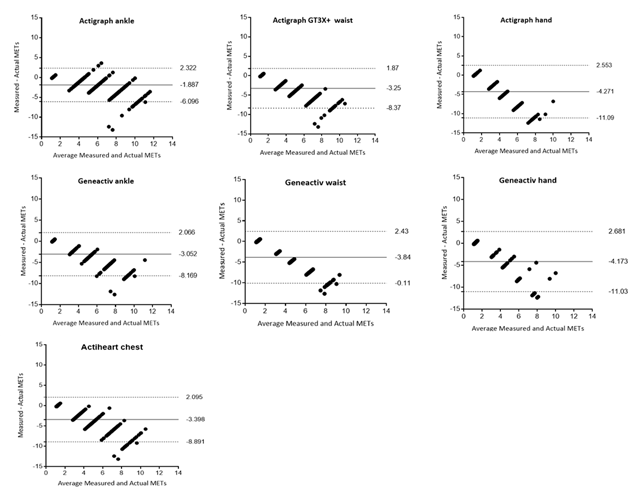
Figure 1
Bland-Altman plot for comparing the agreement between physical activity energy expenditure (METs) calculated by accelerometers (Measured) and the ETT (Actual). The difference of estimate of moderate physical activity from the Measured and the Actual (y-axis) are depicted in relation to the mean of estimates of physical activity from the Measured and the Actual (x-axis).
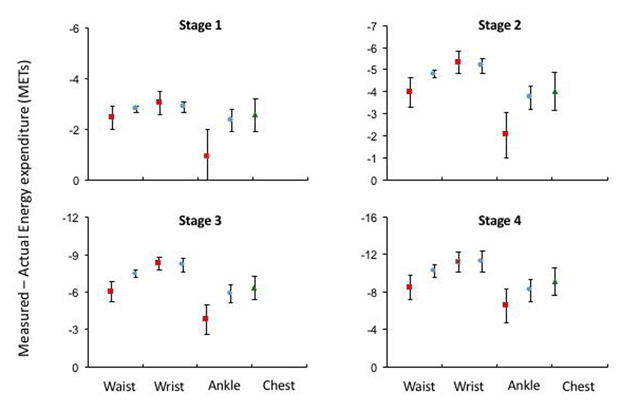
Figure 2
Mean difference between Measured (from the accelerometery device) and Actual (from the ETT) energy expenditure during rest and active stages of graded exercise test. (Red square: Actigraph GT3X+; Blue circle: Geneactiv; green triangle; Actiheart).
Table 2
Mean difference between Measured (from the accelerometery device) and Actual (from the treadmill test) energy expenditure (METs) during graded exercise test. P-values are for the difference between Measured and Actual (paired samples t-test).
| Device | Stage 1(4.6 Mets) | Stage 2(7.0 Mets) | Stage 3(10.1 Mets) | Stage 4(13.4 Mets) | Phet* |
|---|---|---|---|---|---|
| Actigraph-GT3X+ | |||||
| Ankle | –0.91 (1.08) | –2.03 (1.03) | –3.81 (1.19) | –6.52 (1.77) | 0.8 |
| Waist | –2.45 (0.44) | –3.95 (0.66) | –6.02 (0.81) | –8.46 (1.29) | 0.7 |
| Hand | –3.03 (0.46) | –5.33 (0.49) | –8.29 (0.52) | –11.17 (1.03) | 0.9 |
| Geneactiv | |||||
| Ankle | –2.34 (0.43) | –3.73 (0.54) | –5.87 (0.75) | –8.17 (1.19) | 0.7 |
| Waist | –2.78 (0.14) | –4.80 (0.18) | –7.45 (0.29) | –10.24 (0.64) | 0.7 |
| Hand | –2.86 (0.19) | –5.18 (0.34) | –8.19 (0.56) | –11.21 (1.10) | 0.8 |
| Actiheart | |||||
| Chest | –2.55 (0.66) | –4.03 (0.86) | –6.35 (0.89) | –9.09 (1.43) | 0.7 |
[i] All P-values for difference between Measured and Actual MET.minutes: P < 0.001.
* Phet represents p-value for comparison of differences between South Asians and Europeans.
Table 3
Impact of age, gender, ethnicity and anthropometric measurements on the relationship between Measured (from the accelerometer) and Actual (from the treadmill test) energy expenditure. Results are presented as Beta (95% CI). Beta coefficients represent the relationship between Measured and Actual energy expenditure, before and after adjusting for the respective clinical variable. P values are calculated by regression analysis with adjustment for age, gender and ethnicity. Statistical significance inferred at P < 0.001 (i.e. P < 0.05 after conservative Bonferroni correction for multiple testing).
| Waist | Wrist | Ankle | Chest | ||||
|---|---|---|---|---|---|---|---|
| Actigraph | Geneactiv | Actigraph | Geneactiv | Actigraph | Geneactiv | Actiheart | |
| Accelerometer | 2.38 (2.25_2.51) | 5.58 (5.29_5.87) | 3.00 (2.44_3.57) | 3.65 (3.01_4.30) | 1.43 (1.34_1.51) | 2.51 (2.38_2.64) | 2.28 (2.11_2.46) |
| Age | 2.40 (2.27_2.54) | 5.57 (5.28_5.86) | 3.02 (2.43_3.60) | 3.61 (2.95_4.26) | 1.43 (1.35_1.52) | 2.50 (2.37_2.63) | 2.27 (2.10_2.45) |
| Sex | 2.40 (2.27_2.54) | 5.57 (5.28_5.86) | 3.01 (2.42_3.59) | 3.65 (3.00_4.31) | 1.44 (1.35_1.52) | 2.50 (2.37_2.63) | 2.27 (2.10_2.45) |
| Ethnicity | 2.40 (2.27_2.54) | 5.57 (5.28_5.86) | 3.01 (2.42_3.59) | 3.65 (3.00_4.31) | 1.44 (1.35_1.52) | 2.50 (2.37_2.63) | 2.27 (2.10_2.45) |
| Height | 2.40 (2.27_2.54) | 5.59 (5.31_5.88) | 3.00 (2.42_3.59) | 3.66 (3.01_4.32) | 1.44 (1.35_1.53) | 2.50 (2.37_2.63) | 2.28 (2.11_2.45) |
| Weight | 2.40 (2.27_2.54) | 5.57 (5.28_5.87) | 3.01 (2.43_3.60) | 3.63 (2.98_4.29) | 1.43 (1.35_1.52) | 2.50 (2.37_2.63) | 2.31 (2.14_2.48) |
| Body mass index | 2.40 (2.27_2.54) | 5.57 (5.28_5.87) | 3.01 (2.43_3.60) | 3.63 (2.98_4.29) | 1.43 (1.35_1.52) | 2.50 (2.37_2.63) | 2.31 (2.14_2.48) |
| Waist | 2.40 (2.26_2.53) | 5.56 (5.27_5.85) | 3.02 (2.43_3.60) | 3.61 (2.96_4.27) | 1.43 (1.34_1.52) | 2.50 (2.37_2.63) | 2.34 (2.17_2.51) |
| Hip | 2.41 (2.27_2.54) | 5.58 (5.29_5.87) | 3.04 (2.46_3.62) | 3.64 (2.98_4.29) | 1.44 (1.35_1.52) | 2.51 (2.38_2.64) | 2.33 (2.16_2.50) |
| Waist hip ratio | 2.40 (2.26_2.53) | 5.55 (5.27_5.84) | 2.99 (2.40_3.57) | 3.63 (2.98_4.29) | 1.43 (1.35_1.52) | 2.49 (2.37_2.62) | 2.28 (2.10_2.45) |
| Smoking | 2.40 (2.27_2.54) | 5.57 (5.28_5.86) | 3.04 (2.45_3.62) | 3.70 (3.04_4.35) | 1.44 (1.35_1.53) | 2.50 (2.37_2.63) | 2.27 (2.10_2.45) |
| Functional status | 2.41 (2.27_2.54) | 5.57 (5.28_5.86) | 3.06 (2.47_3.65) | 3.73 (3.08_4.38) | 1.44 (1.35_1.53) | 2.50 (2.37_2.63) | 2.28 (2.10_2.46) |
| Angina | 2.40 (2.26_2.53) | 5.56 (5.27_5.85) | 3.02 (2.43_3.60) | 3.64 (2.98_4.29) | 1.44 (1.35_1.53) | 2.50 (2.37_2.63) | 2.27 (2.09_2.44) |
| Myocardial Infarction | 2.41 (2.27_2.54) | 5.59 (5.30_5.88) | 3.05 (2.46_3.63) | 3.65 (3.00_4.31) | 1.44 (1.35_1.53) | 2.50 (2.37_2.63) | 2.27 (2.10_2.45) |
| CABG/PCI | 2.40 (2.27_2.54) | 5.57 (5.28_5.86) | 3.04 (2.45_3.63) | 3.66 (3.00_4.31) | 1.44 (1.35_1.53) | 2.50 (2.37_2.63) | 2.27 (2.10_2.45) |
| Type 2 Diabetes | 2.40 (2.27_2.54) | 5.56 (5.28_5.85) | 3.00 (2.42_3.59) | 3.64 (2.99_4.30) | 1.44 (1.35_1.52) | 2.50 (2.37_2.63) | 2.27 (2.10_2.45) |
| Hypertension | 2.40 (2.26_2.53) | 5.56 (5.27_5.85) | 3.00 (2.42_3.59) | 3.65 (3.00_4.30) | 1.44 (1.35_1.53) | 2.53 (2.40_2.66) | 2.27 (2.09_2.44) |
[i] Results are presented as Beta (95%CI). Beta coefficient represents the change in Actual METs per unit change in Measured METs.