
Table 1
Subjects situation to participate testing (N = 12).
| Age (years) | Mass (kg) | Height (cm) |
|---|---|---|
| 24.00 ± 1.20 | 59.30 ± 4.70 | 165.57 ± 3.60 |
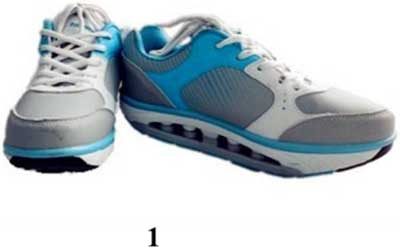
Figure 1
Unstable shoes.
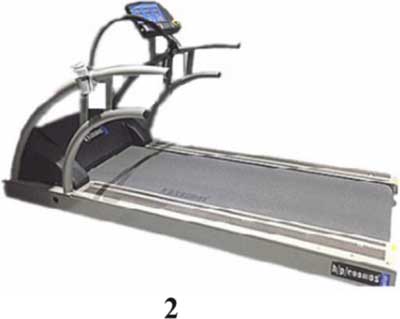
Figure 2
H/P/COSMED, Gaitway.
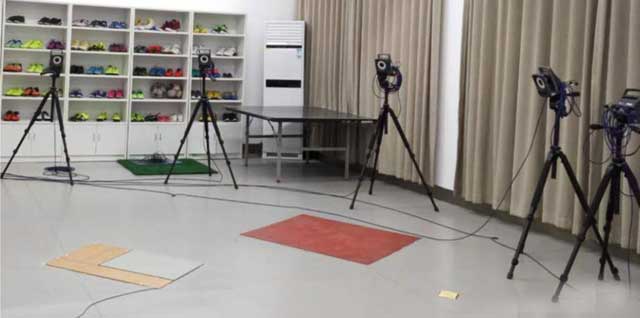
Figure 3
The 8-camera Vicon motion analysis system (Oxford Metrics Ltd., Oxford, UK).
Table 2
Peak angle and ROM of hip in three planes while walking with different speeds (N = 12).
| Slow walking (0.8 m/s) | Normal walking (1.2 m/s) | Fast walking (1.7 m/s) | |||
|---|---|---|---|---|---|
| Hip | Sagittal plane | Flexion | 26.84 ± 0.27a | 24.57 ± 0.78 | 25.79 ± 1.24 |
| Extension | –5.97 ± 0.33a | –7.25 ± 0.17b | –9.81 ± 0.52c | ||
| ROM | 32.81 ± 0.30 | 31.82 ± 0.84b | 35.60 ± 1.25c | ||
| Coronal plane | Abduction | 14.03 ± 0.74a | 15.69 ± 0.52 | 16.38 ± 0.31c | |
| Adduction | 1.78 ± 0.81 | 2.37 ± 0.20 | 1.79 ± 0.67 | ||
| ROM | 12.26 ± 1.23 | 13.32 ± 0.50 | 14.58 ± 0.84c | ||
| Horizontal plane | Internal rotation | –22.63 ± 0.57 | –20.42 ± 0.73b | –17.91 ± 1.38c | |
| External rotation | –48.93 ± 0.54a | –44.24 ± 1.78 | –45.21 ± 1.26c | ||
| ROM | 26.30 ± 0.89 | 23.82 ± 1.37 | 27.30 ± 2.13 |
[i] Note: unit: degree (°), a,b,c indicate significant difference, p < 0.05 (a represents slow and normal walking; b represents normal and fast walking; c represents slow and fast walking).
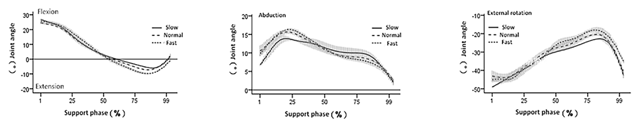
Figure 4
Mean joint angel curve of right hip in the stance of walking with different speeds (N = 12).
Table 3
Peak angle and ROM of knee in three planes while walking with different speeds (N = 12).
| Slow walking (0.8 m/s) | Normal walking (1.2 m/s) | Fast walking (1.7 m/s) | |||
|---|---|---|---|---|---|
| Knee | Sagittal | Flexion | 29.93 ± 0.09a | 33.85 ± 1.15 | 32.83 ± 1.34c |
| Extension | –2.77 ± 0.13 | –2.17 ± 0.62 | –0.97 ± 0.55c | ||
| ROM | 32.70 ± 0.16a | 36.01 ± 0.69 | 33.80 ± 1.54 | ||
| Coronal plane | Abduction | –2.21 ± 0.34 | –0.40 ± 3.88b | –6.90 ± 0.80 | |
| Adduction | –31.11 ± 2.33 | –32.53 ± 0.84 | –29.45 ± 0.43 | ||
| ROM | 28.91 ± 2.02 | 32.13 ± 3.05b | 22.55 ± 0.81c | ||
| Horizontal plane | Internal rotation | 12.84 ± 2.52 | 12.89 ± 0.54b | 16.98 ± 0.73c | |
| External rotation | 4.60 ± 0.66a | 6.02 ± 0.50b | 4.49 ± 0.45 | ||
| ROM | 8.24 ± 1.88 | 6.88 ± 0.96b | 12.49 ± 1.06c |
[i] Note: unit: degree (°), a,b,c indicate significant difference, p < 0.05 (a represents slow and normal walking; b represents normal and fast walking; c represents slow and fast walking).
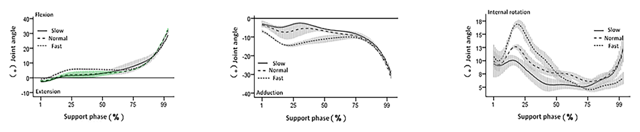
Figure 5
Mean joint angel curve of right knee in the stance of walking with different speeds (N = 12).
Table 4
Peak angle and ROM of ankle in three planes while walking with different speeds (N = 12).
| Slow walking (0.8 m/s) | Normal walking (1.2 m/s) | Fast walking (1.7 m/s) | |||
|---|---|---|---|---|---|
| Ankle | Sagittal plane | Dorsiflexion | 15.78 ± 1.32a | 20.05 ± 1.67 | 19.00 ± 0.31c |
| Plantarflexion | –9.96 ± 0.77a | –6.73 ± 0.90b | –9.02 ± 0.51 | ||
| ROM | 25.74 ± 2.04 | 26.78 ± 2.17 | 28.14 ± 0.06 | ||
| Coronal plane | Eversion | –2.05 ± 1.89 | –3.52 ± 0.29 | –3.91 ± 0.15 | |
| Inversion | –6.70 ± 0.22 | –6.50 ± 0.23b | –7.31 ± 0.14c | ||
| ROM | 4.65 ± 1.84 | 2.99 ± 0.31 | 3.28 ± 0.28 | ||
| Horizontal plane | Internal rotation | 33.86 ± 1.02 | 33.61 ± 1.78 | 36.64 ± 0.61 | |
| External rotation | 13.89 ± 0.50 | 15.29 ± 0.36b | 18.68 ± 0.95c | ||
| ROM | 19.97 ± 0.64 | 18.31 ± 1.42 | 17.96 ± 1.54 |
[i] Note: unit: degree(°), a,b,c indicate significant difference, p < 0.05 (a represents slow and normal walking; b represents normal and fast walking; c represents slow and fast walking).
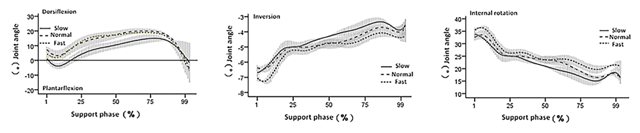
Figure 6
Mean joint angel curve of right ankle in the stance of walking with different speeds (N = 12).