
Table 1
The basic situation of the subjects.
| Group | age (Y) | high (cm) | weight (kg) | exercise time (h/D) |
|---|---|---|---|---|
| Training (15) | 13.5 ± 0.8 | 163.6 ± 1.2 | 48.5 ± 2.2 | More than 1.5h |
| Non training (15) | 13.2 ± 1.1 | 162.8 ± 2.2 | 45.9 ± 3.6 | Within 0.5 |
Table 2
Time distance parameter (n = 22).
| Group | Step length (cm) | Step frequency (pace/min) | Walking speeding (m/s) |
|---|---|---|---|
| Exercise group | 56.47 ± 4.09** | 94.8 ± 8.42 | 1.3 ± 0.1* |
| Non exercise group | 52.72 ± 3.55 | 102.14 ± 7.5* | 1.22 ± 0.15 |
[i] Note: *Indicates that there was a clear difference between the two (P < 0.05).
**Indicates that there was a very clear difference between the two groups (P < 0.01).
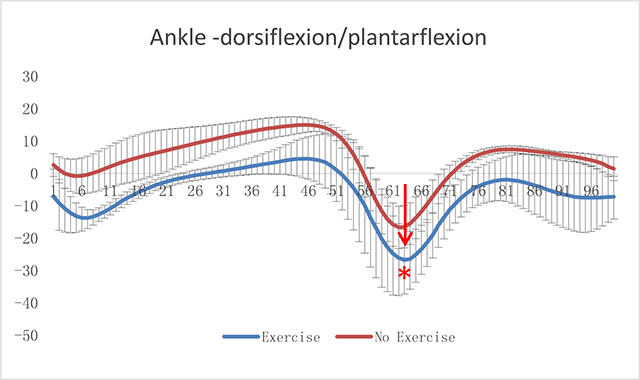
Figure 1
The ankle angle changing curve in sagittal plane (*indicates a significant difference, P < 0.05).
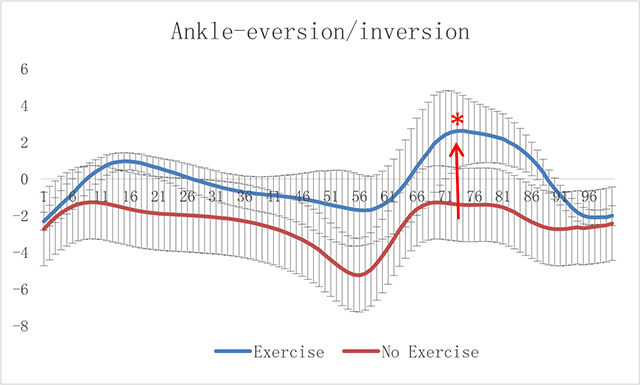
Figure 2
The ankle angle changing curve in horizontal plane (*means a significant difference, P < 0.05).
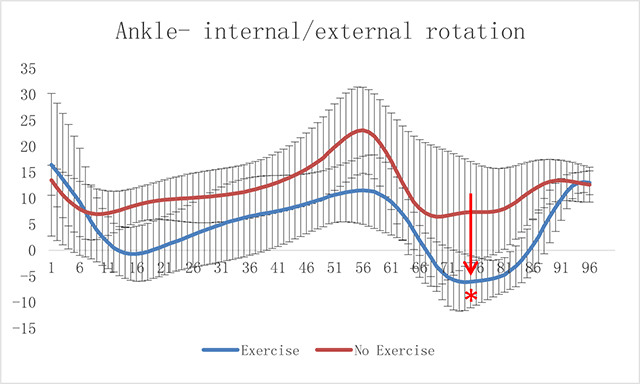
Figure 3
The ankle angle changing curve in coronal section (*means a significant difference, P < 0.05).
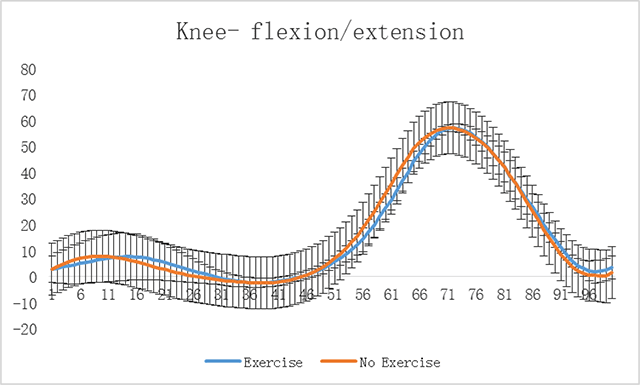
Figure 4
The knee angle changing curve in vertical plane (*means a significant difference, P < 0.05).
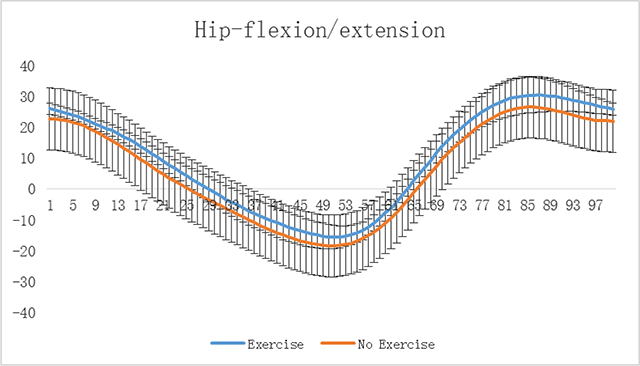
Figure 5
The hip angle changing curve in vertical plane (*means a significant difference, P < 0.05).