
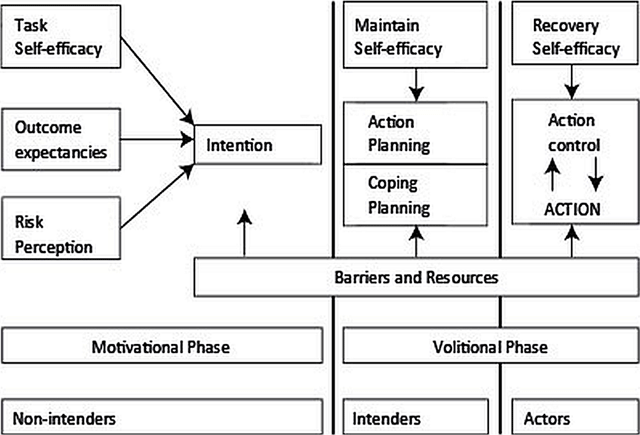
Figure 1
The model of the Health Action Process Approach (HAPA).

Figure 2
Outline of the physical activity program.
Table 1
Characteristics of the participants.
| n | % | |
|---|---|---|
| Age (years) | ||
| Mean | 42.42 | |
| SD | 12.84 | |
| Gender | ||
| Male | 10 | 50 |
| Female | 10 | 50 |
| Disability group* | ||
| Amputation | 1 | 5 |
| Cerebral Palsy | 3 | 15 |
| Hearing Impairment | 5 | 25 |
| Learning Disability | 5 | 25 |
| Restricted Growth | 2 | 10 |
| Spinal Cord Injury | 3 | 15 |
| Visual Impairment | 5 | 25 |
| Living arrangements** | ||
| Independent alone | 6 | 30 |
| Independent, with spouse and/or children | 6 | 30 |
| Living at home (with parents) | 5 | 25 |
| Residential care | 1 | 5 |
| Other | 2 | 10 |
| PA history | ||
| Yes | 18 | 90 |
[i] * Four participants had multiple disabilities.
** Other living arrangements were living with four housemates and living with a niece.
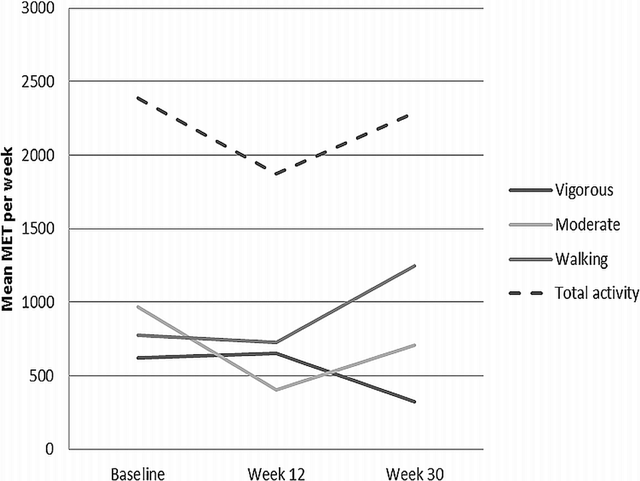
Figure 3
Mean METs per week per activity.
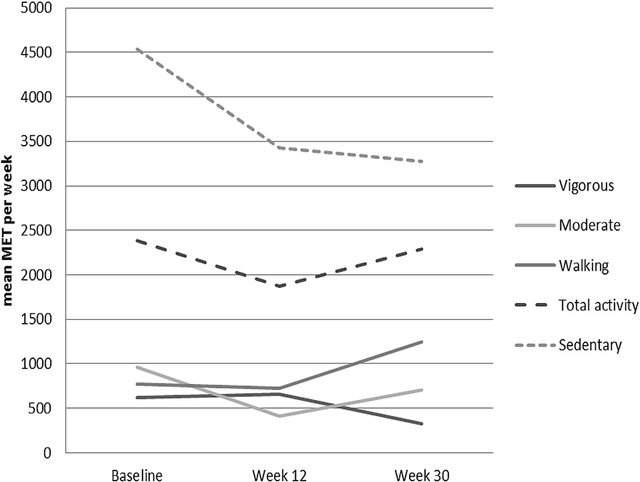
Figure 4
Mean METs per week per activity, including sedentary time.
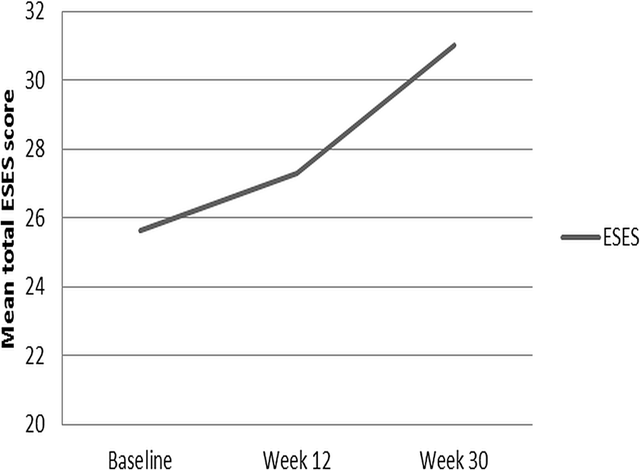
Figure 5
Mean total ESES scores for baseline, week 12 and week 30.