
Table 1
Participants’ demographics.
| Characteristic | Mean (SD) |
|---|---|
| Age (years) | 25.0 (1.0) |
| Height (cm) | 165.6 (1.52) |
| Weight (kg) | 55.62 (3.37) |
| Body mass index | 20.03 (1.11) |
| Right leg length (cm) | 85.8 (2.95) |
[i] Note: Leg length was measured from the anterior superior iliac spine to the medial malleolus.
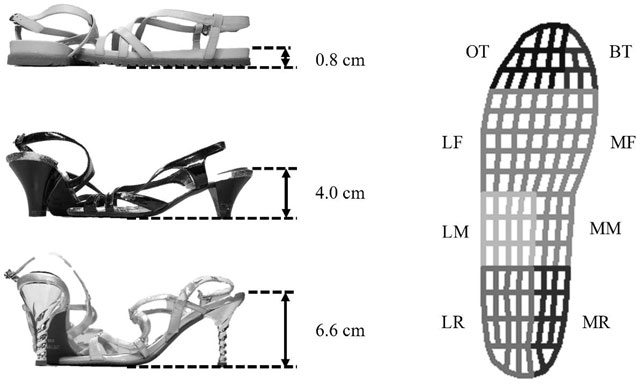
Figure 1
Shoes used in the test (left) and sub-divided plantar areas of the stance limb (right).
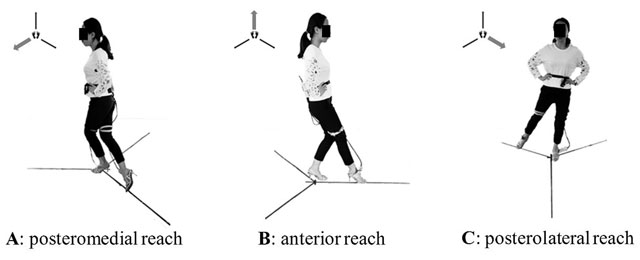
Figure 2
Reach directions in the SEBT.
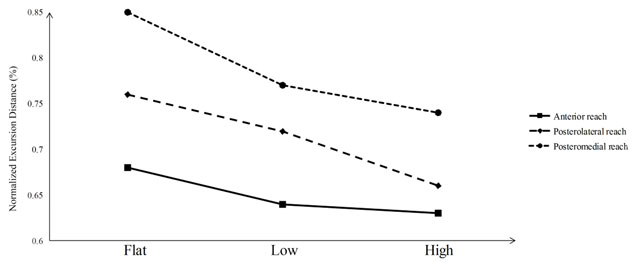
Figure 3
Comparison of normalized excursion distance (%) in the SEBT between different shoes.
Table 2
Normalized excursion distance (%) in anterior, posterolateral and posteromedial directions in the SEBT, Mean (SD).
| Flat | Low | High | p-value | |
|---|---|---|---|---|
| Anterior | 0.68 (0.04) | 0.64 (0.07) | 0.63 (0.07) | 0.000 |
| Posterolateral | 0.76 (0.07) | 0.72 (0.08) | 0.66 (0.08) | 0.000 |
| Posteromedial | 0.85 (0.77) | 0.77 (0.83) | 0.74 (0.11) | 0.000 |
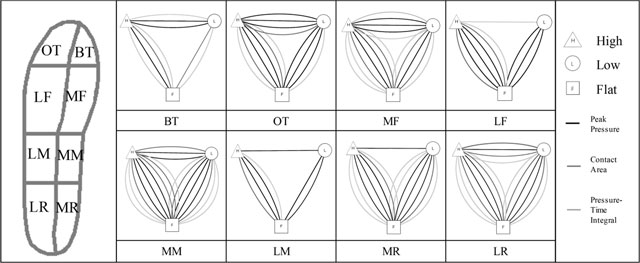
Figure 4
Visualizing network of significant differences in peak pressure, contact area and pressure-time integration between different shoes.
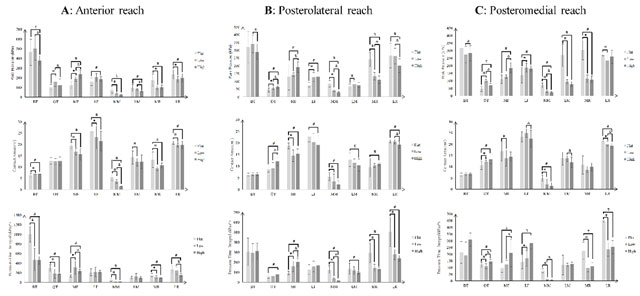
Figure 5
Comparison of peak pressure, contact area and pressure-time integral in three reaching directions between different shoes.
Note: #, * and & indicate significant difference, p <.05 (* for comparison between Flat and Low, # for comparison between Flat and High; & for comparison between Low and High).