
Table 1
Descriptive statistics for age and anthropometrics and differences between groups according to prevalence of smoking and alcohol drinking. Data are given as Means ± standard deviations, if not specified otherwise.
| CIGARETTE SMOKING | ALCOHOL CONSUMPTION | |||||
|---|---|---|---|---|---|---|
| NO | YES | T-TEST (P) | NO | YES | T-TEST (P) | |
| Age (years) | 16.2 ± 0.8 | 16.5 ± 0.9 | –9.1 (0.001) | 16.1 ± 0.8 | 16.5 ± 0.9 | 8.8 (0.001) |
| Body mass (kg) | 65.3 ± 13.0 | 67.8 ± 14.1 | –4.6 (0.001) | 63.6 ± 12.9 | 66.7 ± 13.4 | 4.0 (0.001) |
| Body height (cm) | 171.4 ± 10.6 | 171.8 ± 11.6 | –0.9 (0.33) | 169.6 ± 13.9 | 172.0 ± 10.6 | 3.8 (0.001) |
| Body Mass Index (kg/m2) | 22.3 ± 4.8 | 23.2 ± 5.8 | –3.9 (0.001) | 22.5 ± 6.9 | 22.6 ± 4.6 | 0.6 (0.55) |
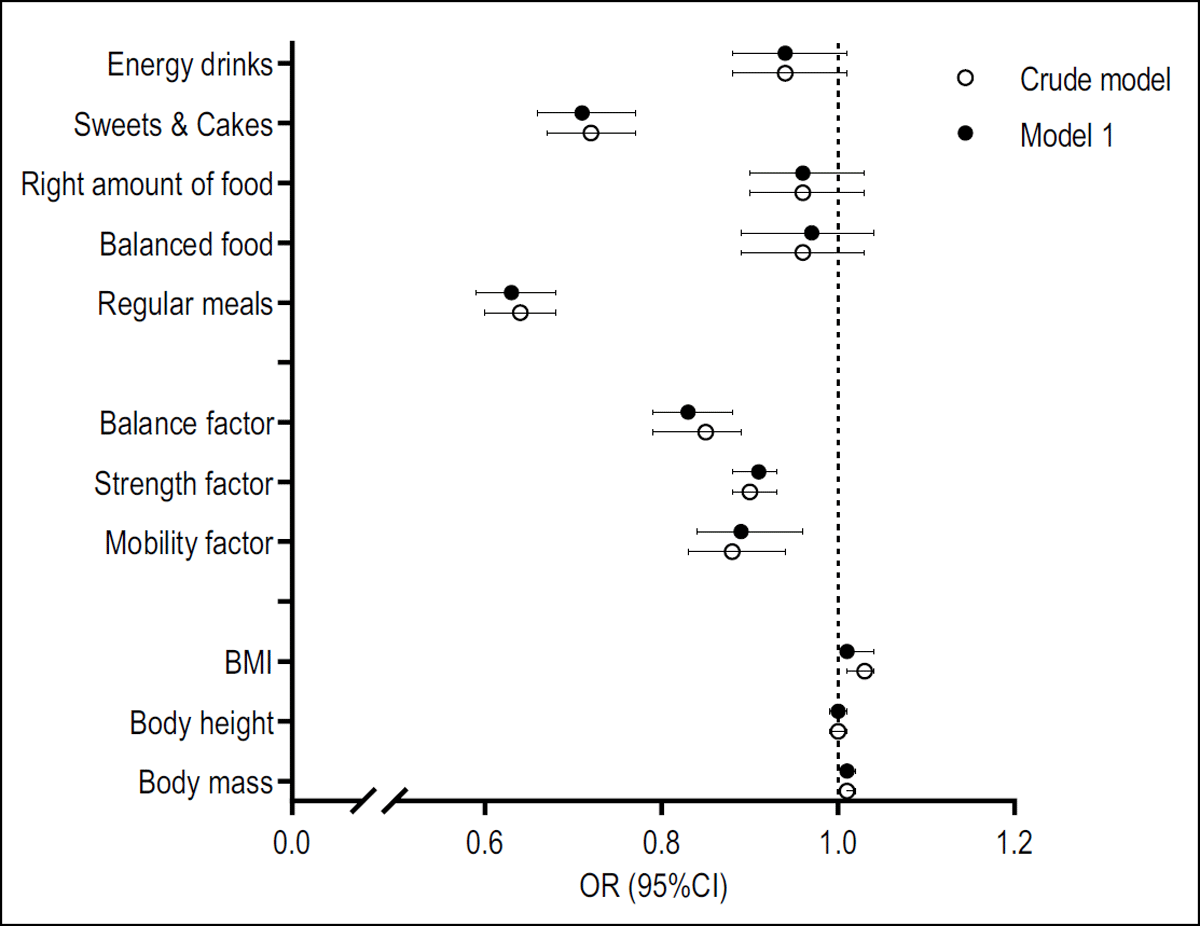
Figure 1
Logistic regression results for criterion “cigarette smoking” (Crude model: model without covariates, Model 1: age and gender are included as covariates).
○ = Crude model: model without covariates; • = Model 1: age and gender are included as covariates; BMI = Body Mass Index.
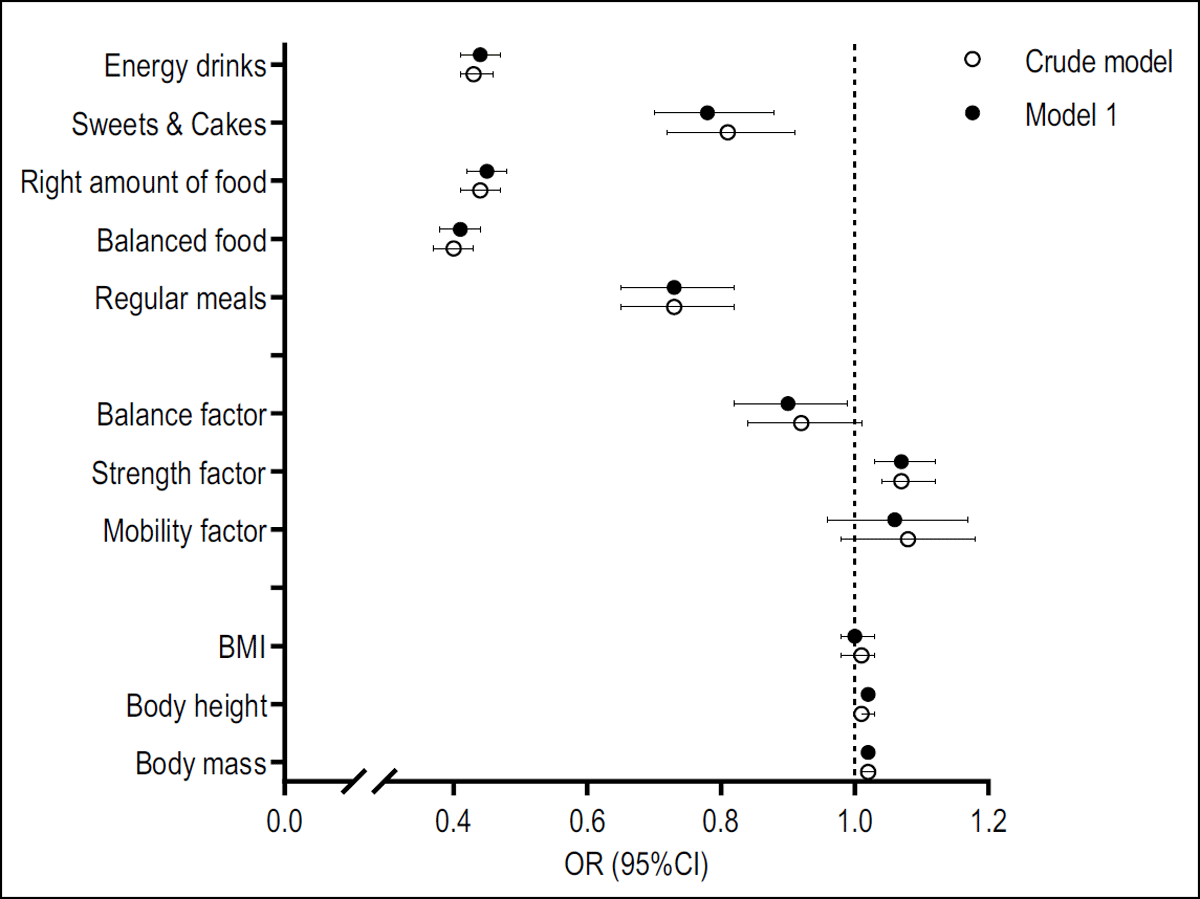
Figure 2
Logistic regression results for criterion “alcohol consumption” (Crude model: model without covariates, Model 1: age and gender are included as covariates).
○ = Crude model: model without covariates; • = Model 1: age and gender are included as covariates; BMI = Body Mass Index.