

Figure 1
Experiment procedures and variables of interest.
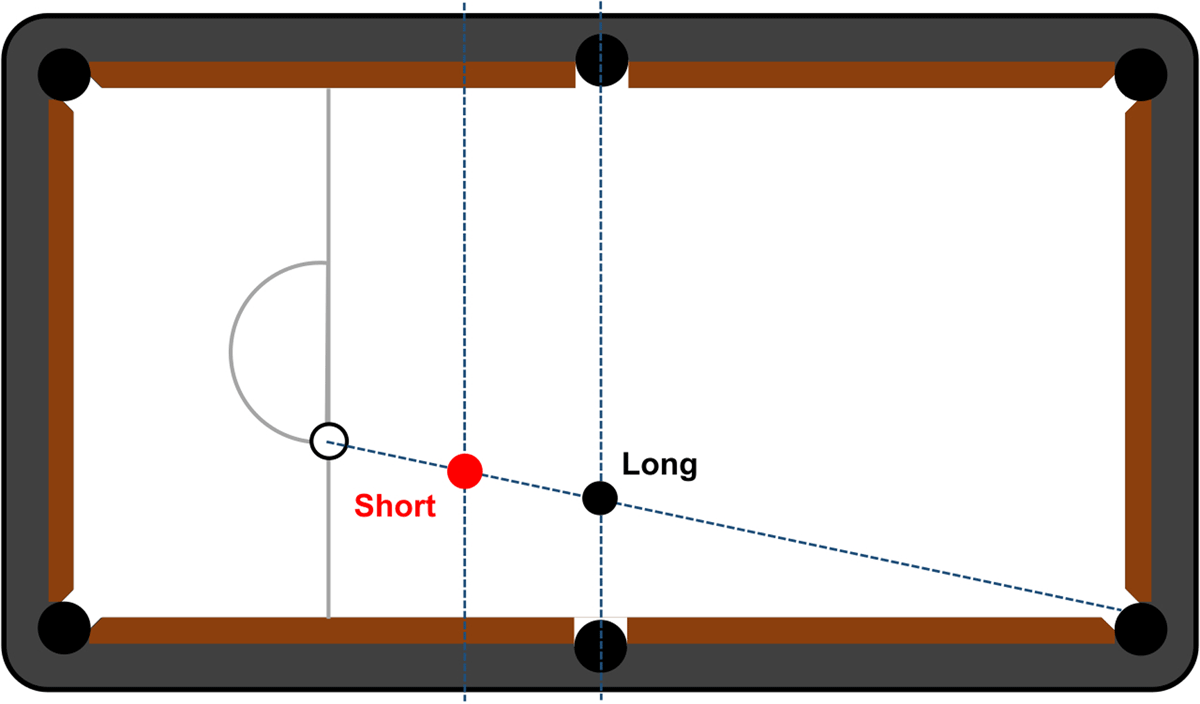
Figure 2
Setup of the cue ball (white) and a near object ball (red) for the short shots and a far object ball (black) for the long shot situations.
Table 1
Protocols of the five selected types of shots in snooker.
| Tasks | Object ball distance | Description |
|---|---|---|
| Warm-up | Short | To conduct a short pot without any spin. |
| Stun | Short | To pot the near object ball with great power and no spin, such that the cue ball continues to move forward slightly after impact. |
| Top spin | Short | To pocket the near object ball with top spin such that the cue ball continues going forward after impact. |
| Back spin | Long | To pot the far object ball with back spin such that the cue ball is drawn back after impact. |
| Stop | Long | To perform a long pot and park the cue ball immediately after impact. |
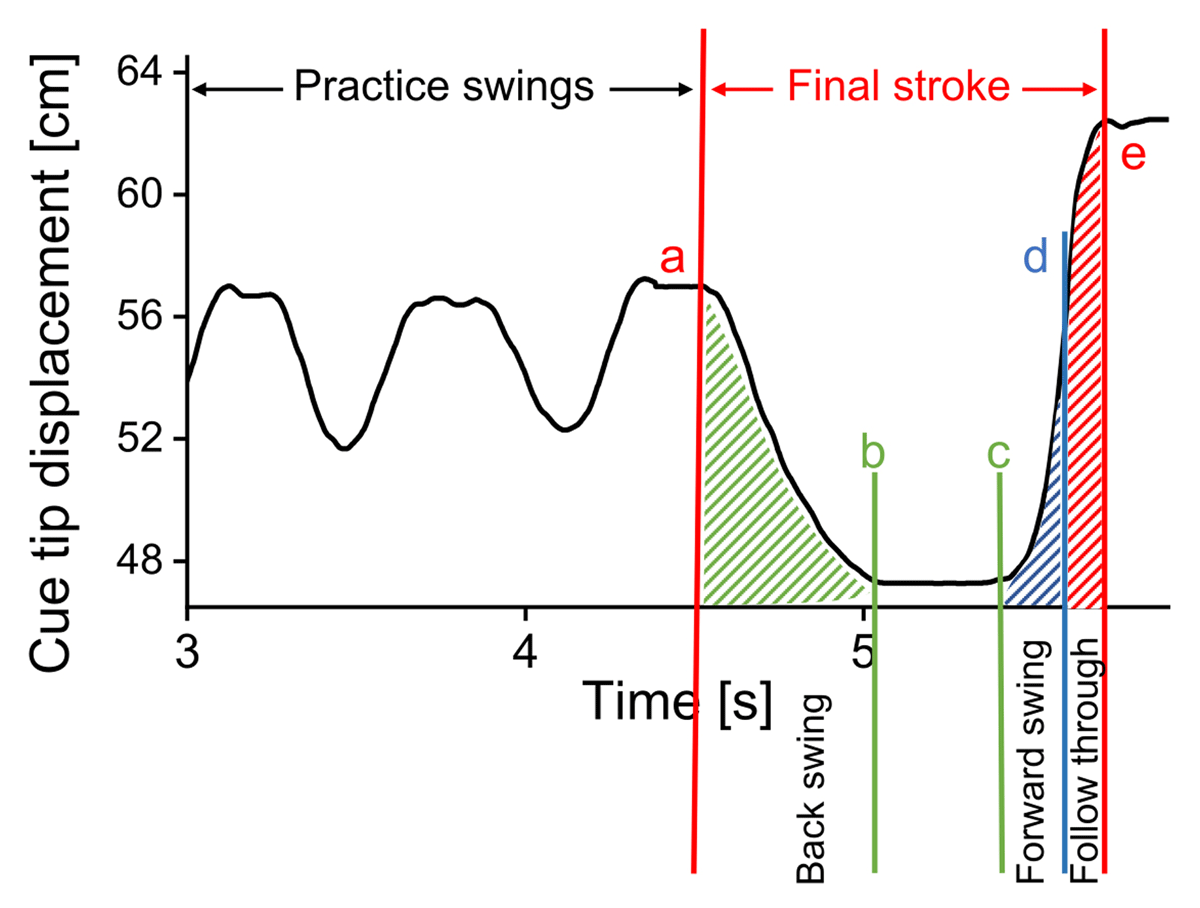
Figure 3
Key moments defined in a stroke of the cueing movement: (a) start of back swing, (b) end of back swing, (c) start of forward swing, (d) impact, and (e) end of follow through.
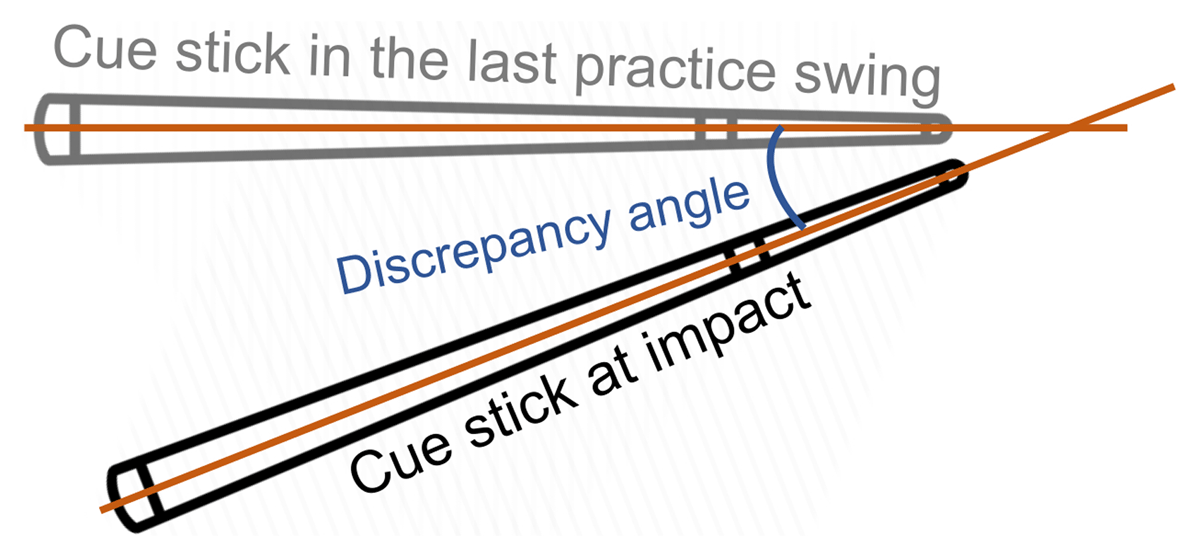
Figure 4
Definition of the discrepancy angle to indicate the overlap in cue stick positions between the last practice swing and the final stroke.
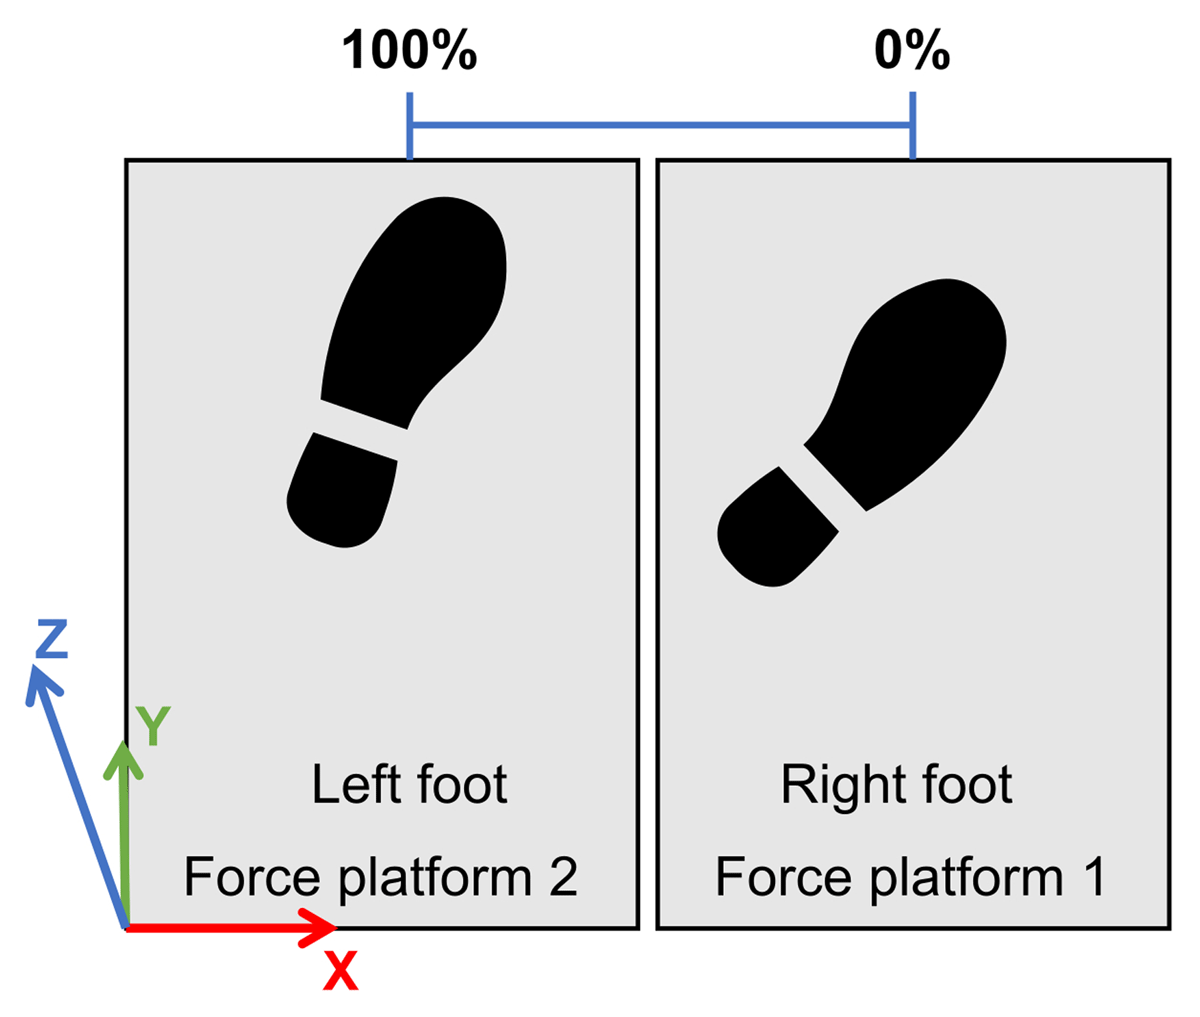
Figure 5
Schematic representation of the player’s stance posture on two force platforms and the centre of pressure expressed as the percentage of the distance between two feet (COPx%).
Table 2
Kinematic data of the cue stick and upper limb joints in five selected shots in snooker.
| Warm-up | Stun | Top spin | Back spin | Stop | |
|---|---|---|---|---|---|
| Successful rate | 1/3 | 1/3 | 3/3 | 1/3 | 1/3 |
| Discrepancy angle [°] | 0.6 (0.1) | 0.8 (0.1) | 0.9 (0.1) | 0.4 (0.1) | 0.9 (0.1) |
| Cue tip speed at impact [m/s] | 1.24 (0.04) | 2.57 (0.11) | 2.58 (0.23) | 4.02 (0.04) | 2.99 (0.15) |
| Wrist ROM [°] | 26.9 (0.8) | 27.9 (0.8) | 28.4 (1.0) | 25.4 (1.2) | 29.7 (1.0) |
| Elbow ROM [°] | 128.3 (1.0) | 136.7 (0.2) | 137.6 (1.1) | 141.2 (2.5) | 138.0 (1.2) |
[i] Results are shown as mean (standard deviation) of 3 trials for each type of shot.
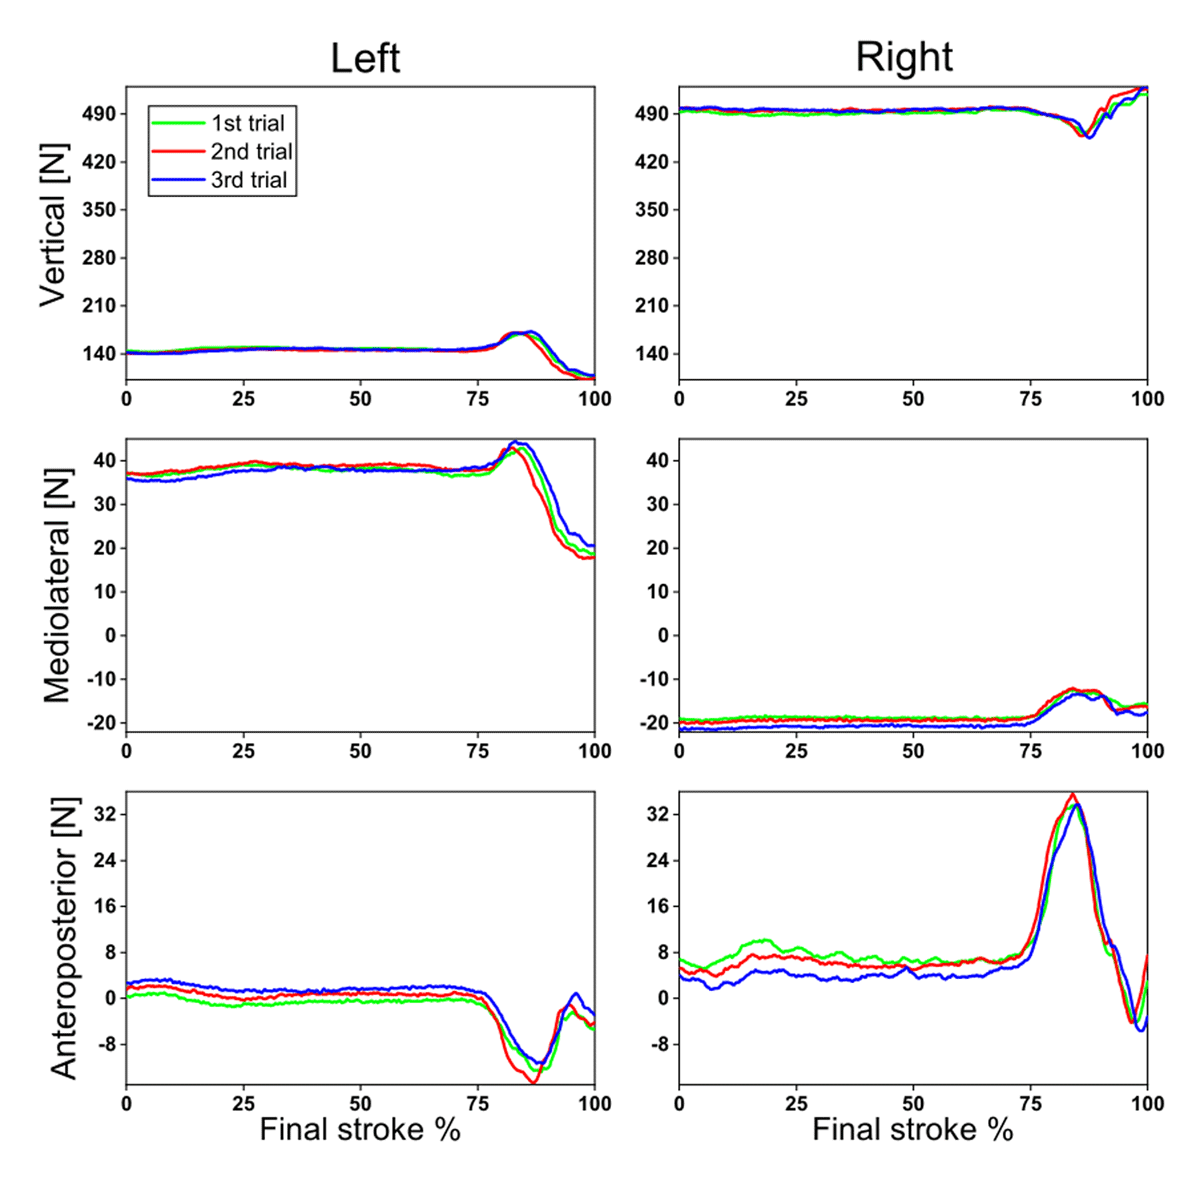
Figure 6
Representative ground reaction forces of 3 trials of the back spin shot (final stroke).
Table 3
Transfer of weight (expressed as COPx%) at five key moments in the final stroke.
| Moment a | Moment b | Moment c | Moment d | Moment e | |
|---|---|---|---|---|---|
| Warm-up | 61.7 (0.6) | 61.7 (0.7) | 61.6 (0.7) | 61.5 (0.8) | 61.6 (0.8) |
| Stun | 61.5 (0.6) | 61.4 (0.7) | 61.3 (0.7) | 61.1 (0.8) | 61.1 (0.7) |
| Top spin | 60.1 (0.9) | 59.9 (0.8) | 59.8 (0.8) | 59.6 (0.7) | 59.8 (0.8) |
| Back spin | 60.6 (0.4) | 60.5 (0.4) | 60.2 (0.2) | 60.3 (0.4) | 60.1 (0.4) |
| Stop | 61.0 (0.4) | 60.8 (0.4) | 60.8 (0.4) | 60.6 (0.5) | 60.5 (0.4) |
[i] Centre of pressure in the mediolateral direction are shown as a percentage of the distance between the right foot (0%) and left foot (100%). Moment a: start of back swing; Moment b: end of back swing; Moment c: start of forward swing; Moment d: impact; Moment e: end of follow through.