
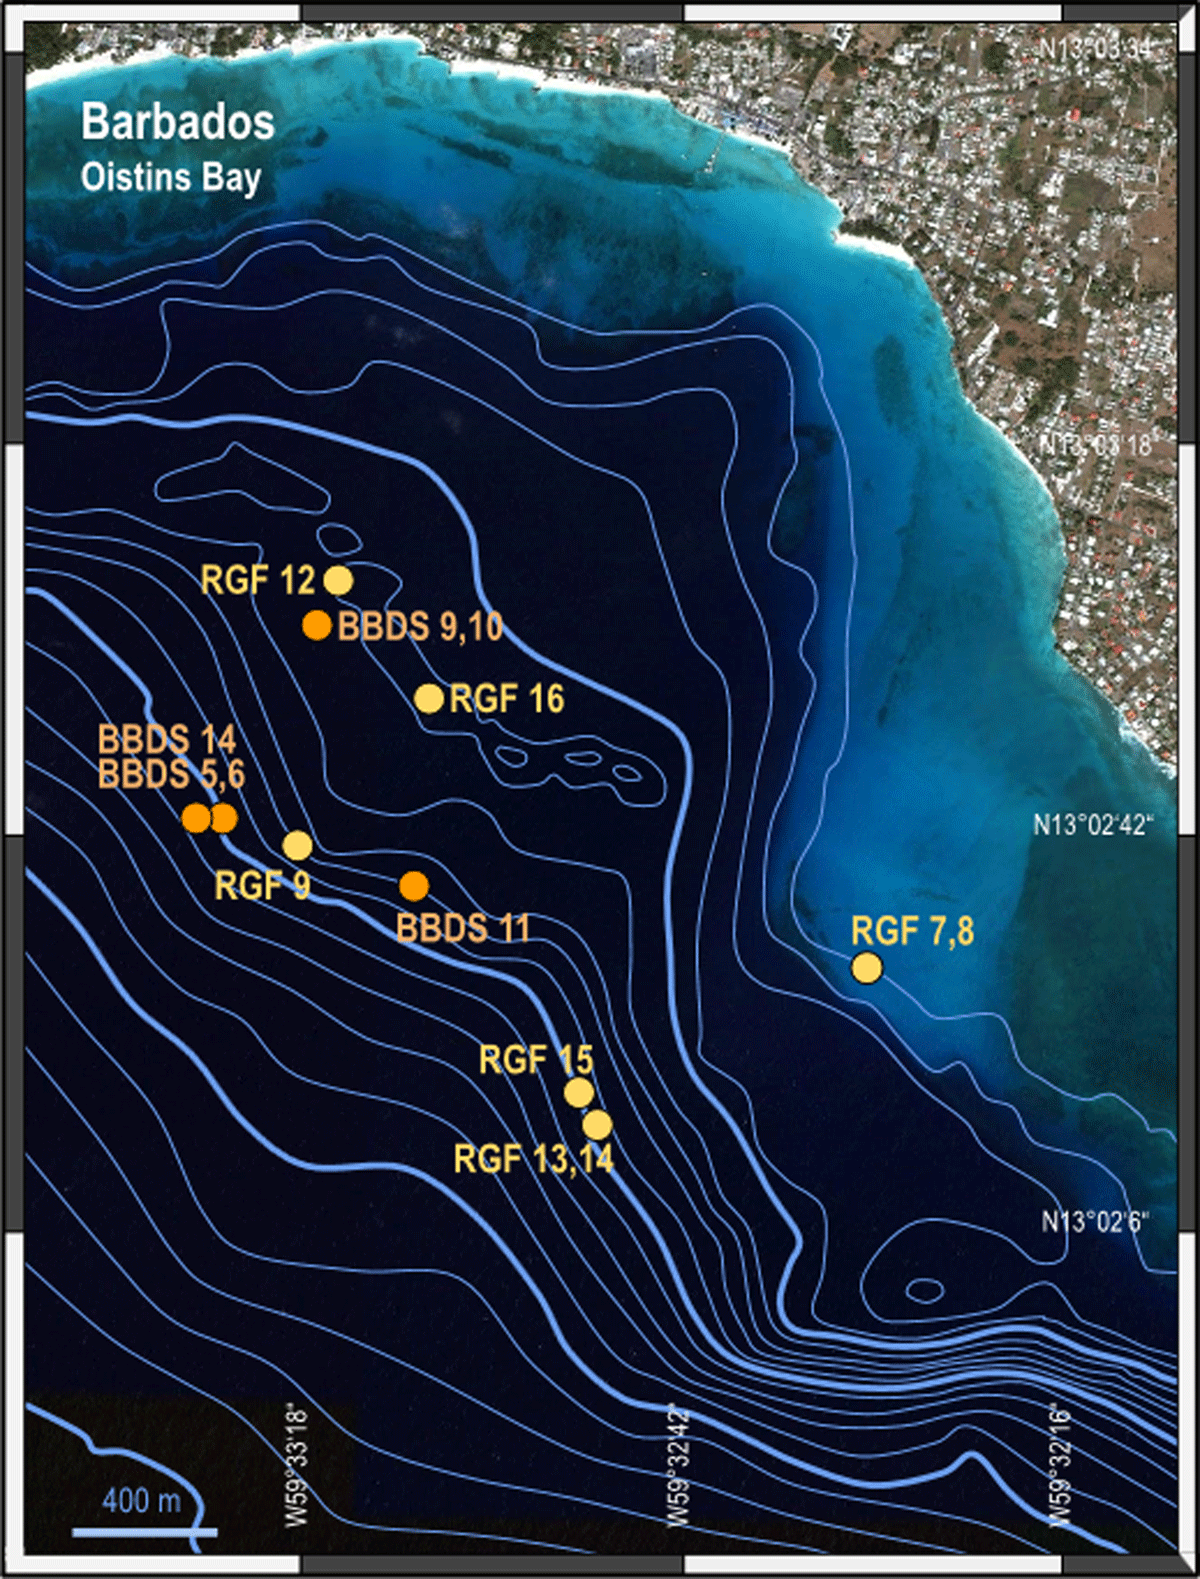
Figure 1
Bathymetry and location of reef cores drilled in Oistins Bay, off the south coast of Barbados (modified after Bard et al 2010 and Abdul 2017). All drill sites are shown for the sake of completeness, but sites RGF-16 and BBDS-9 had limited recovery, and sites RGF-13 and 14 had limited Ap data. Core data from sites BBDS-5, 6, 11 and 14 are yet to be reported.
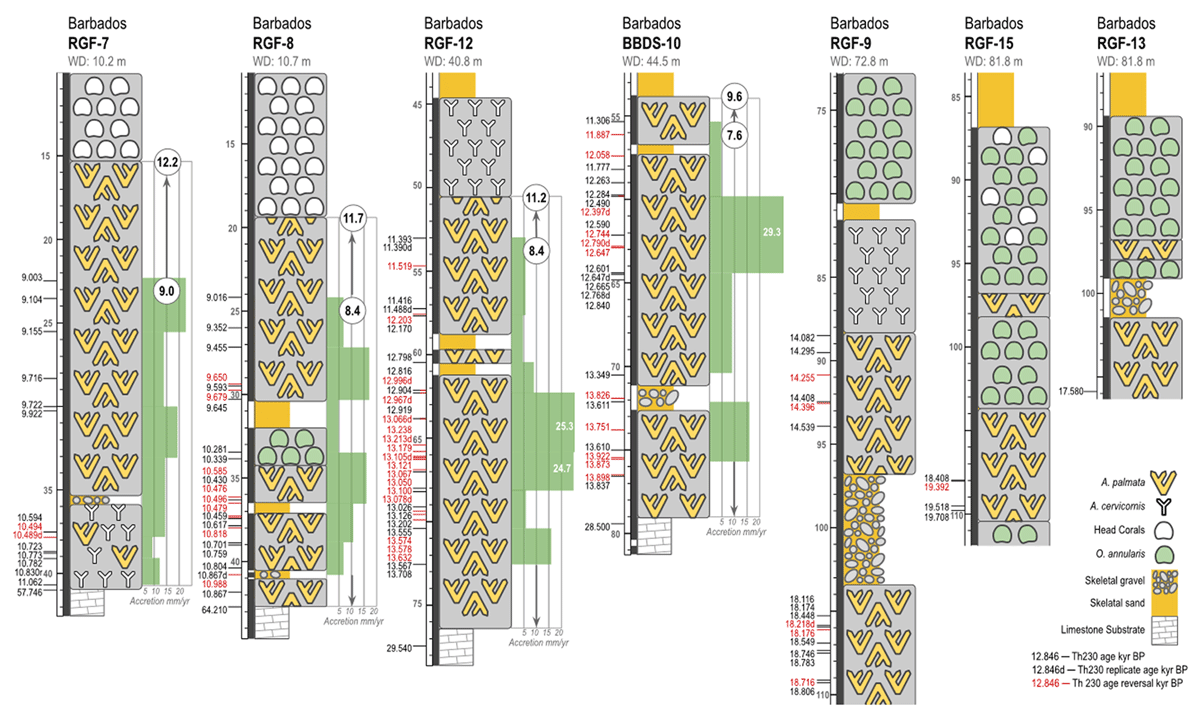
Figure 2
Postglacial reef development at Barbados. Core logs show stratigraphy (m below SL), chronology (Th-230 ages in ka BP), and accretion rates (mm/yr) of reef-crest units containing A. palmata (Ap). Transient accretion rates are shown between stratigraphically-consistent ages, including maximum rates that exceed 20 mm/yr. Also shown is the average accretion rate of the dated interval, as well as the complete unit interval. Stratigraphy and chronology modified from Fairbanks (1989) and Abdul et al. (2016).
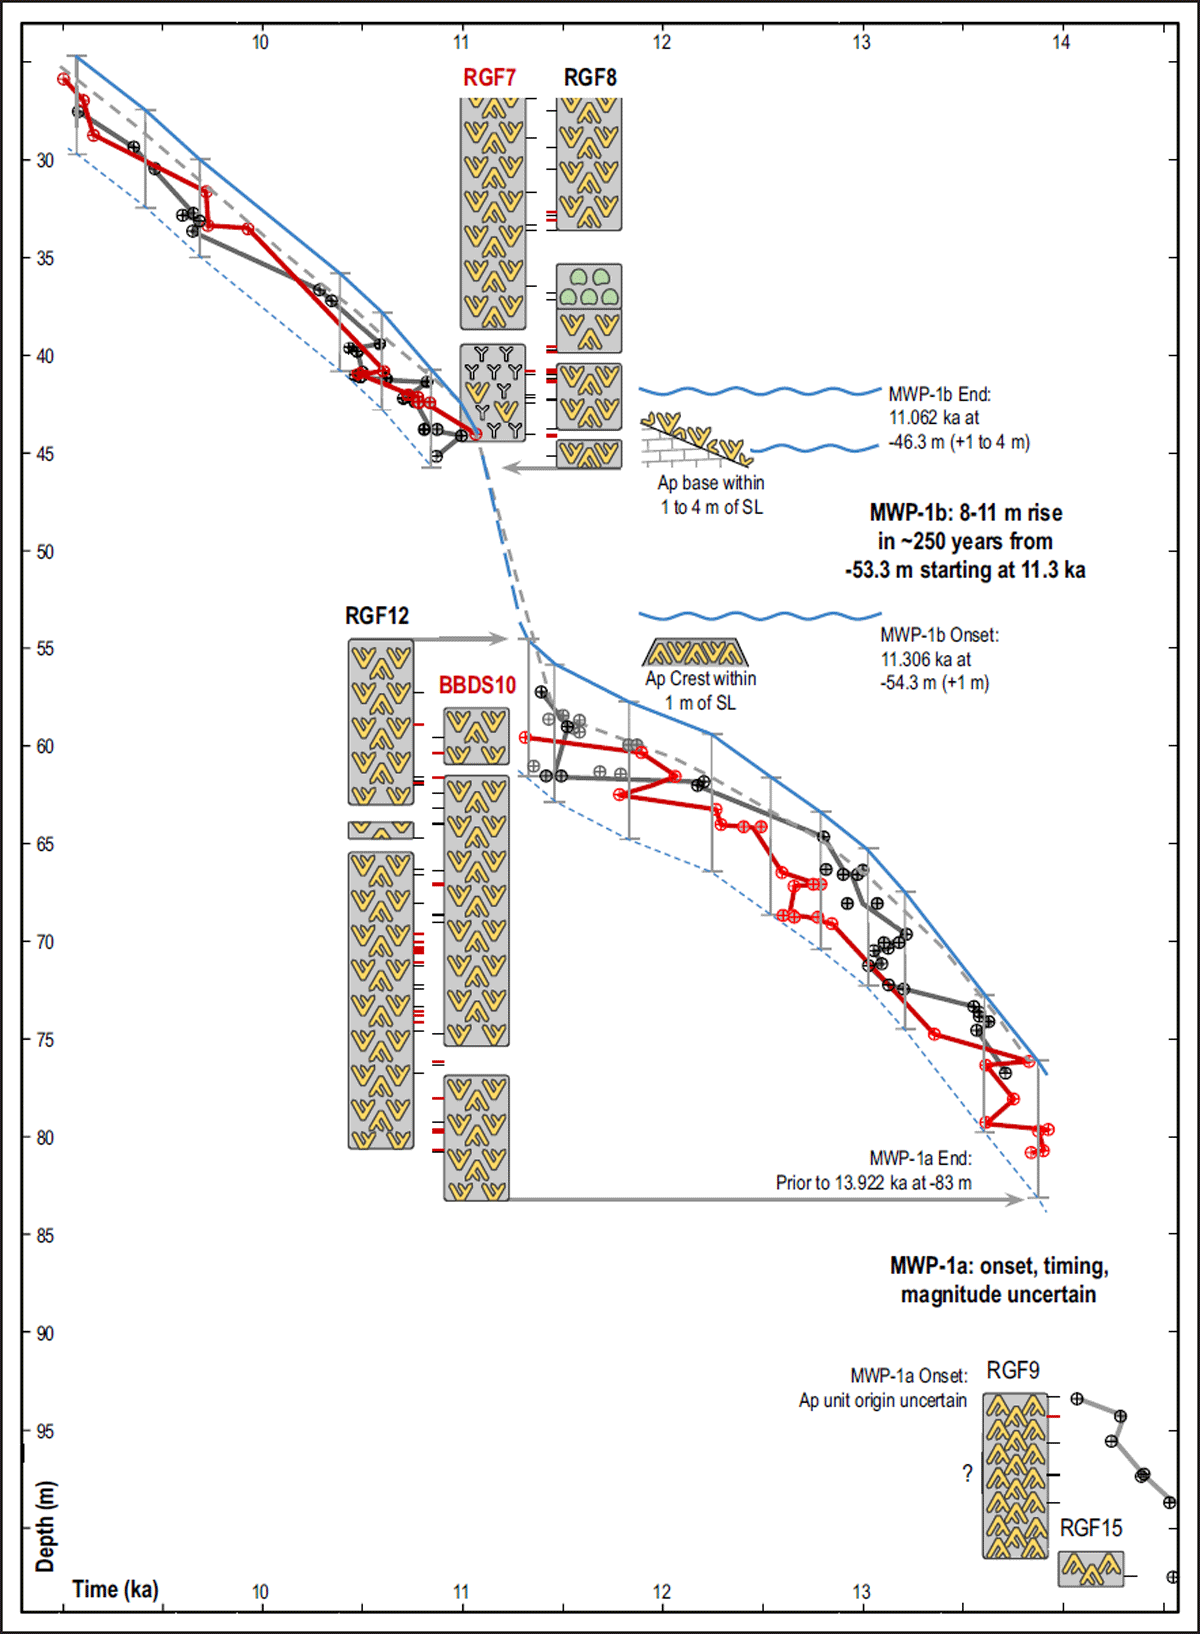
Figure 3
Revised postglacial sea-level (SL) reconstruction for Barbados, showing colour-coded transient accretion trends in individual cores, SL tie-lines, and position, timing, and magnitude of meltwater pulses (uplift corrected). Replicate ages are shown as grey-filled circles and the accretion trend shows mean age. Grey circles are Ap samples from short cores RGF-16 and BBDS-9. Note that all age-data points (circles) have a diameter that is equivalent to the mean analytical error (~50 years). The SL tie-lines show the maximum vertical data range in overlapping cores, and are centred over clusters of coeval ages and sequence tops and bases to produce an upper SL limit (solid blue line), and an envelope of maximum data distribution (dashed blue line). Ap units (not individual samples) in each core are corrected for their mean uplift by assuming a constant uplift rate of 0.34 m/kyr. Also shown are positions of Th-230 ages (inversions in red), and the top and base of the Ap sequence for each backstepping interval. Dashed grey line is the SL reconstruction of Abdul et al. (2016).