
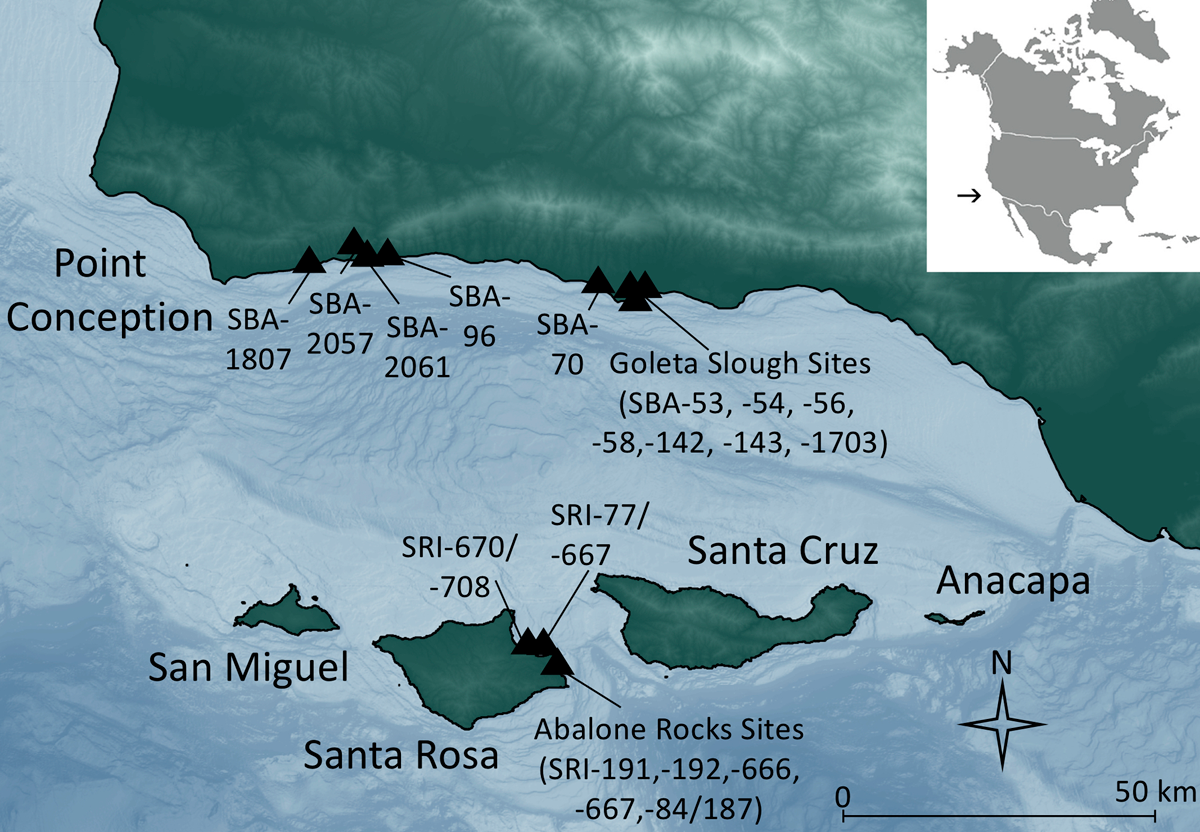
Figure 1
The Santa Barbara Channel region and Northern Channel Islands, showing location of island and mainland sites discussed in the text.
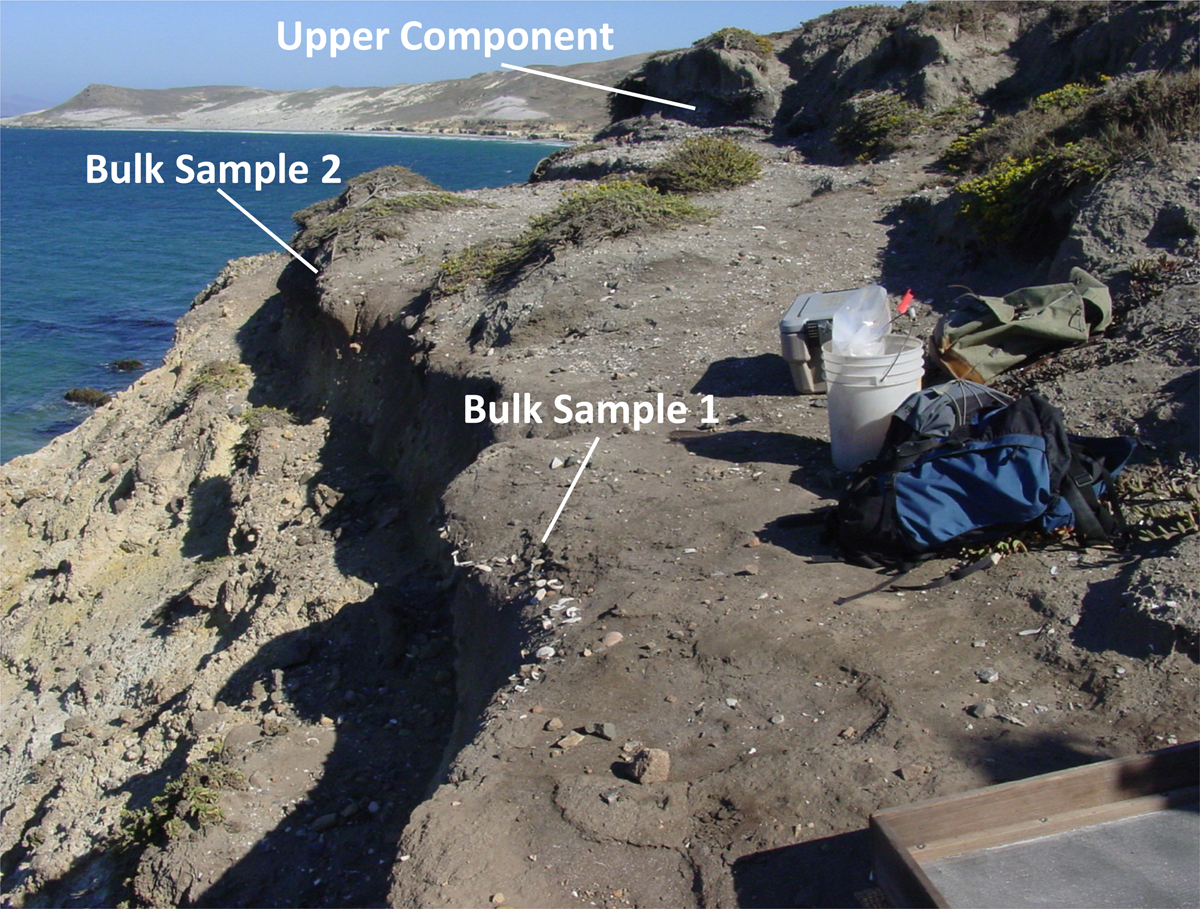
Figure 2
Sea cliff exposure at CA-SRI-77 (looking east) showing the lower component and location of Bulk Samples 1 and 2 and the Upper Component deposits dated to the Late Holocene. Photo by T. Rick, 2003.
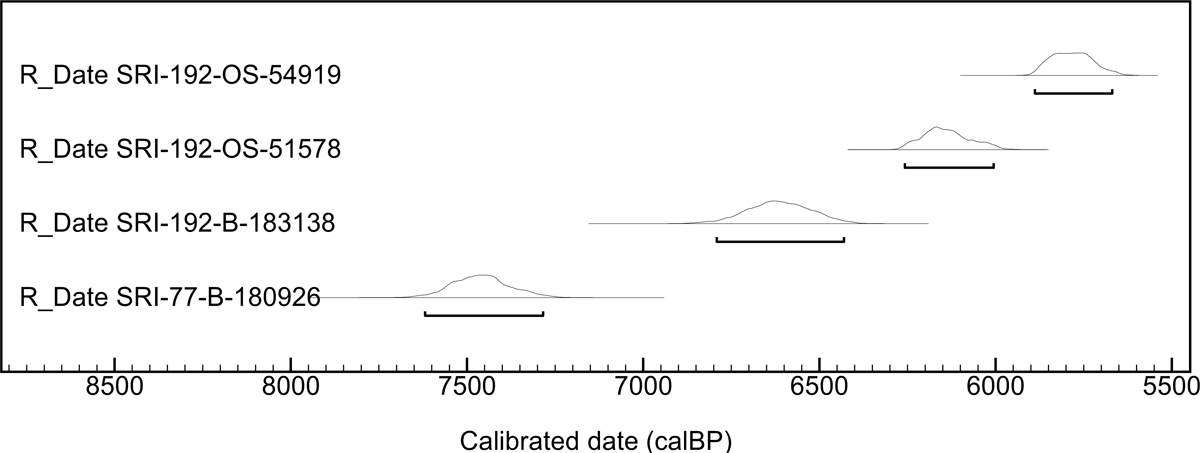
Figure 3
Oxcal plot of the 2 sigma calibrated calendar age for Middle Holocene radiocarbon dates from CA-SRI-77 and CA-SRI-192 presented in Table 1 (Bronk Ramsey 2009).
Table 1
Radiocarbon data from Middle Holocene components at CA-SRI-192 and CA-SRI-77.
| Site | Provenience | Lab Numbera | Material | δ13C | 13C/12C Adjusted Age | Calibrated Age BP (2 Sigma)b |
|---|---|---|---|---|---|---|
| CA-SRI-192 | Unit 1, 10–12 cmbs | OS-54919 | S. nuttalli | 0.79 | 5670 ± 35 | 5890–5660 |
| Unit 1, 60 cmbs | OS-51578 | O. lurida | 1.34 | 5990 ± 40 | 6260–6000 | |
| Probe, southern site margin | B-183138 | O. lurida | — | 6440 ± 70 | 6800–6430 | |
| CA-SRI-77 | Basal midden, sea cliff | B-180926 | C. undatella | — | 7220 ± 90 | 7620–7280 |
[i] a OS = National Ocean Sciences AMS Facility; B = Beta Analytic Inc.
b All shell dates were calibrated with a ΔR of 261 ± 21 years for all shell samples (Jazwa et al. 2012). 13C/12C ratios were determined by the radiocarbon labs. Calibrations were made using the Marine13 calibration Curve (Reimer et al. 2013) and OxCal 4.3 calibration program (Bronk Ramsey 2009). The date from CA-SRI-77 was obtained from Rick et al. (2005) and the dates from CA-SRI-192 were obtained from Rick (2009).
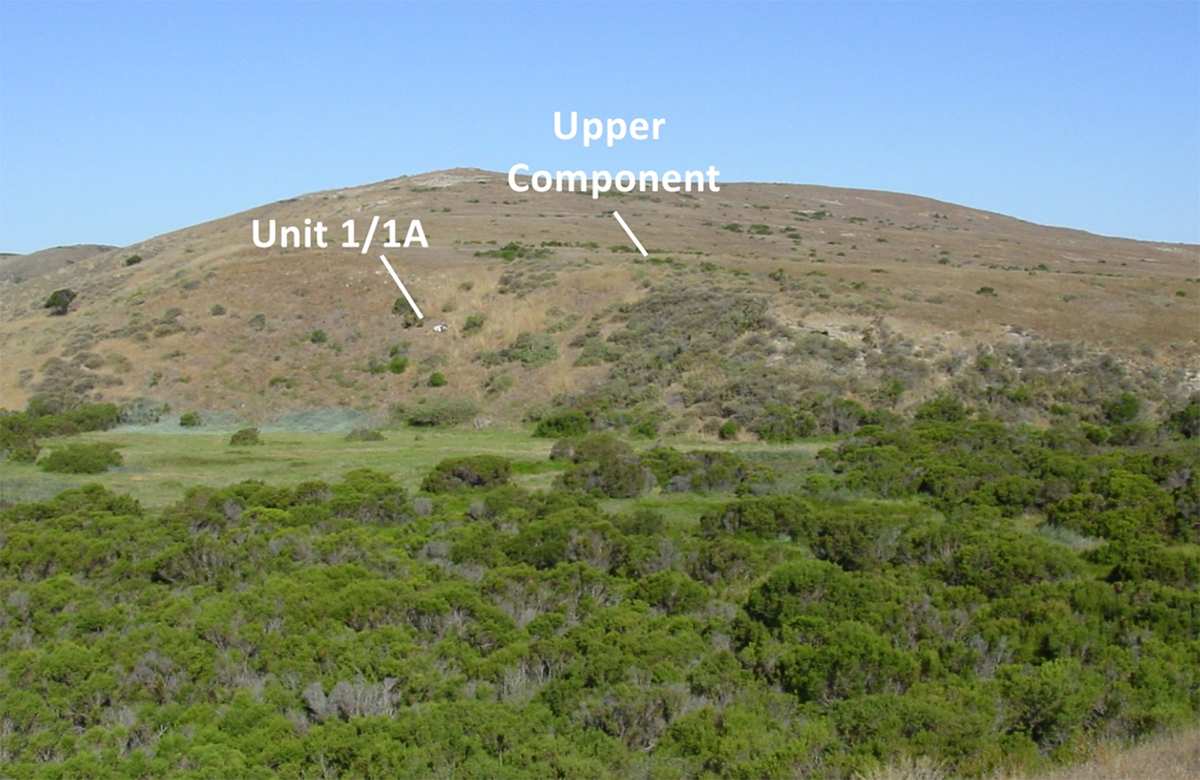
Figure 4
CA-SRI-192 looking west with the site covering most of the area in the center right of the photo, showing approximate location of the Middle Holocene midden exposure at Unit 1/1A and the Upper Component midden dated to the Late Holocene. Photo by T. Rick, 2005.
Table 2
Shellfish remains from CA-SRI-77, Bulk Samples 1 and 2 combined (see Table S2 for individual units).
| Taxon Category | Wt. (g) | % Wt. (g) | MNI | % MNI |
|---|---|---|---|---|
| Bivalves | ||||
| Chione californiensis* | 77.2 | 6.5 | 5 | 5.6 |
| Chione sp.* | 45.1 | 3.8 | 1 | 1.1 |
| Chione undatella* | 206.3 | 17.3 | 12 | 13.5 |
| Chionista fluctifraga* | 18.9 | 1.6 | 1 | 1.1 |
| Mytilus californianus | 275.8 | 23.1 | 32 | 36.0 |
| Ostrea lurida* | 188.1 | 15.7 | 11 | 12. |
| Protothaca staminea* | 3.6 | 0.3 | 1 | 1.1 |
| Septifer bifurcatus | 2.0 | 0.2 | — | — |
| Clam undif. | 39.0 | 3.3 | 5 | 5.6 |
| Crustaceans | ||||
| Balanus spp. | 5.2 | 0.4 | — | — |
| Brachyura (Crab undif.) | 7.9 | 0.7 | — | — |
| Pollicipes polymerus | 0.1 | <0.1 | 1 | 1.1 |
| Gastropods | ||||
| Crepidula sp. | 0.3 | <0.1 | 1 | 1.1 |
| Euspira lewisii* | 45.5 | 3.8 | 3 | 3.4 |
| Haliotis cracherodii | 3.1 | 0.3 | 1 | 1.1 |
| Haliotis rufescens | 219.5 | 18.4 | 2 | 2.3 |
| Lottia gigantea | 1.8 | 0.2 | 1 | 1.1 |
| Megastraea undosa | 0.8 | 0.1 | 1 | 1.1 |
| Nucella sp. | 1.9 | 0.2 | 1 | 1.1 |
| Olivella biplicata | 2.9 | 0.3 | 3 | 3.4 |
| Tegula funebralis | 5.1 | 0.4 | 3 | 3.4 |
| Gastropod undif. | 1.8 | 0.2 | 3 | 3.4 |
| Polyplacophora | ||||
| Cryptochiton stelleri | 6.3 | 0.5 | 1 | 1.1 |
| Chiton undif. | 4.7 | 0.4 | — | — |
| Other | ||||
| Nacre undif. | 14.9 | 1.2 | — | — |
| Marine shell undif. | 18.5 | 1.6 | — | — |
| Total | 1195.8 | — | 89 | — |
[i] * Denotes species commonly found in estuaries. Protothaca, Euspira, and Saxidomus can also occasionally be found in outer coast (Morris et al. 1980).
Table 3
Shellfish remains from CA-SRI-192, Unit 1/1A Combined (see Table S1 for individual units).
| Taxonomic Category | Wt. (g) | %Wt. (g) | MNI | %MNI |
|---|---|---|---|---|
| Bivalves | ||||
| Chione californiensis* | 24.1 | 0.1 | 1 | 0.1 |
| Chione sp.* | 13.5 | 0.1 | ||
| Chione undatella* | 24.6 | 0.1 | 1 | 0.1 |
| Chionista fluctifraga* | 196.7 | 0.8 | 10 | 0.7 |
| Mytilus californianus | 17891.0 | 71.7 | 1022 | 67.9 |
| Ostrea lurida* | 2962.6 | 11.9 | 67 | 4.5 |
| Protothaca sp.* | 4.1 | 0.0 | 1 | 0.1 |
| Septifer bifurcatus | 18.1 | 0.1 | 25 | 1.7 |
| Saxidomus nuttalli* | 713.2 | 2.9 | 14 | 0.9 |
| Crustaceans | ||||
| Brachyura (Crab undif.) | 11.4 | 0.1 | — | — |
| Cirripedia (Barnacle undif.) | 795.7 | 3.2 | — | — |
| Pollicipes polymerus | 8.8 | <0.1 | — | — |
| Echinoderms | ||||
| Strongylocentrotus sp. | 147.7 | 0.6 | — | — |
| Gastropods | ||||
| Conus californicus | 1.2 | <0.1 | — | — |
| Crepidula sp. | 23.8 | 0.1 | 77 | 5.1 |
| Euspira lewisii* | 58.4 | 0.2 | 3 | 0.2 |
| Fissurella volcano | 8.7 | <0.1 | 17 | 1.1 |
| Haliotis cracherodii | 26.3 | 0.1 | 2 | 0.1 |
| Haliotis rufescens | 627.9 | 2.5 | 5 | 0.3 |
| Megastraea undosa | 316.4 | 1.3 | 6 | 0.4 |
| Norrisia norrisi | 33.2 | 0.1 | 1 | 0.1 |
| Olivella biplicata | 14.9 | 0.1 | 18 | 1.2 |
| Tegula funebralis | 122.5 | 0.5 | 34 | 2.3 |
| Vermetidae | 15.0 | 0.1 | — | — |
| Gastropod undif. | 7.8 | <0.1 | 18 | 1.2 |
| Limpet undif. | 10.3 | <0.1 | 181 | 12.0 |
| Polyplacophora | ||||
| Chiton sp. | 12.7 | 0.1 | 2 | 0.1 |
| Other | ||||
| Nacre undif. | 853.5 | 3.4 | — | — |
| Marine shell undif. | 5.1 | <0.1 | — | — |
| Total | 24948.9 | — | 1505 | — |
| Land snail | 1.4 | — | 2 | — |
[i] * Denotes species commonly found in estuaries. Protothaca, Euspira, and Saxidomus can also occasionally be found in outer coast (Morris et al. 1980).
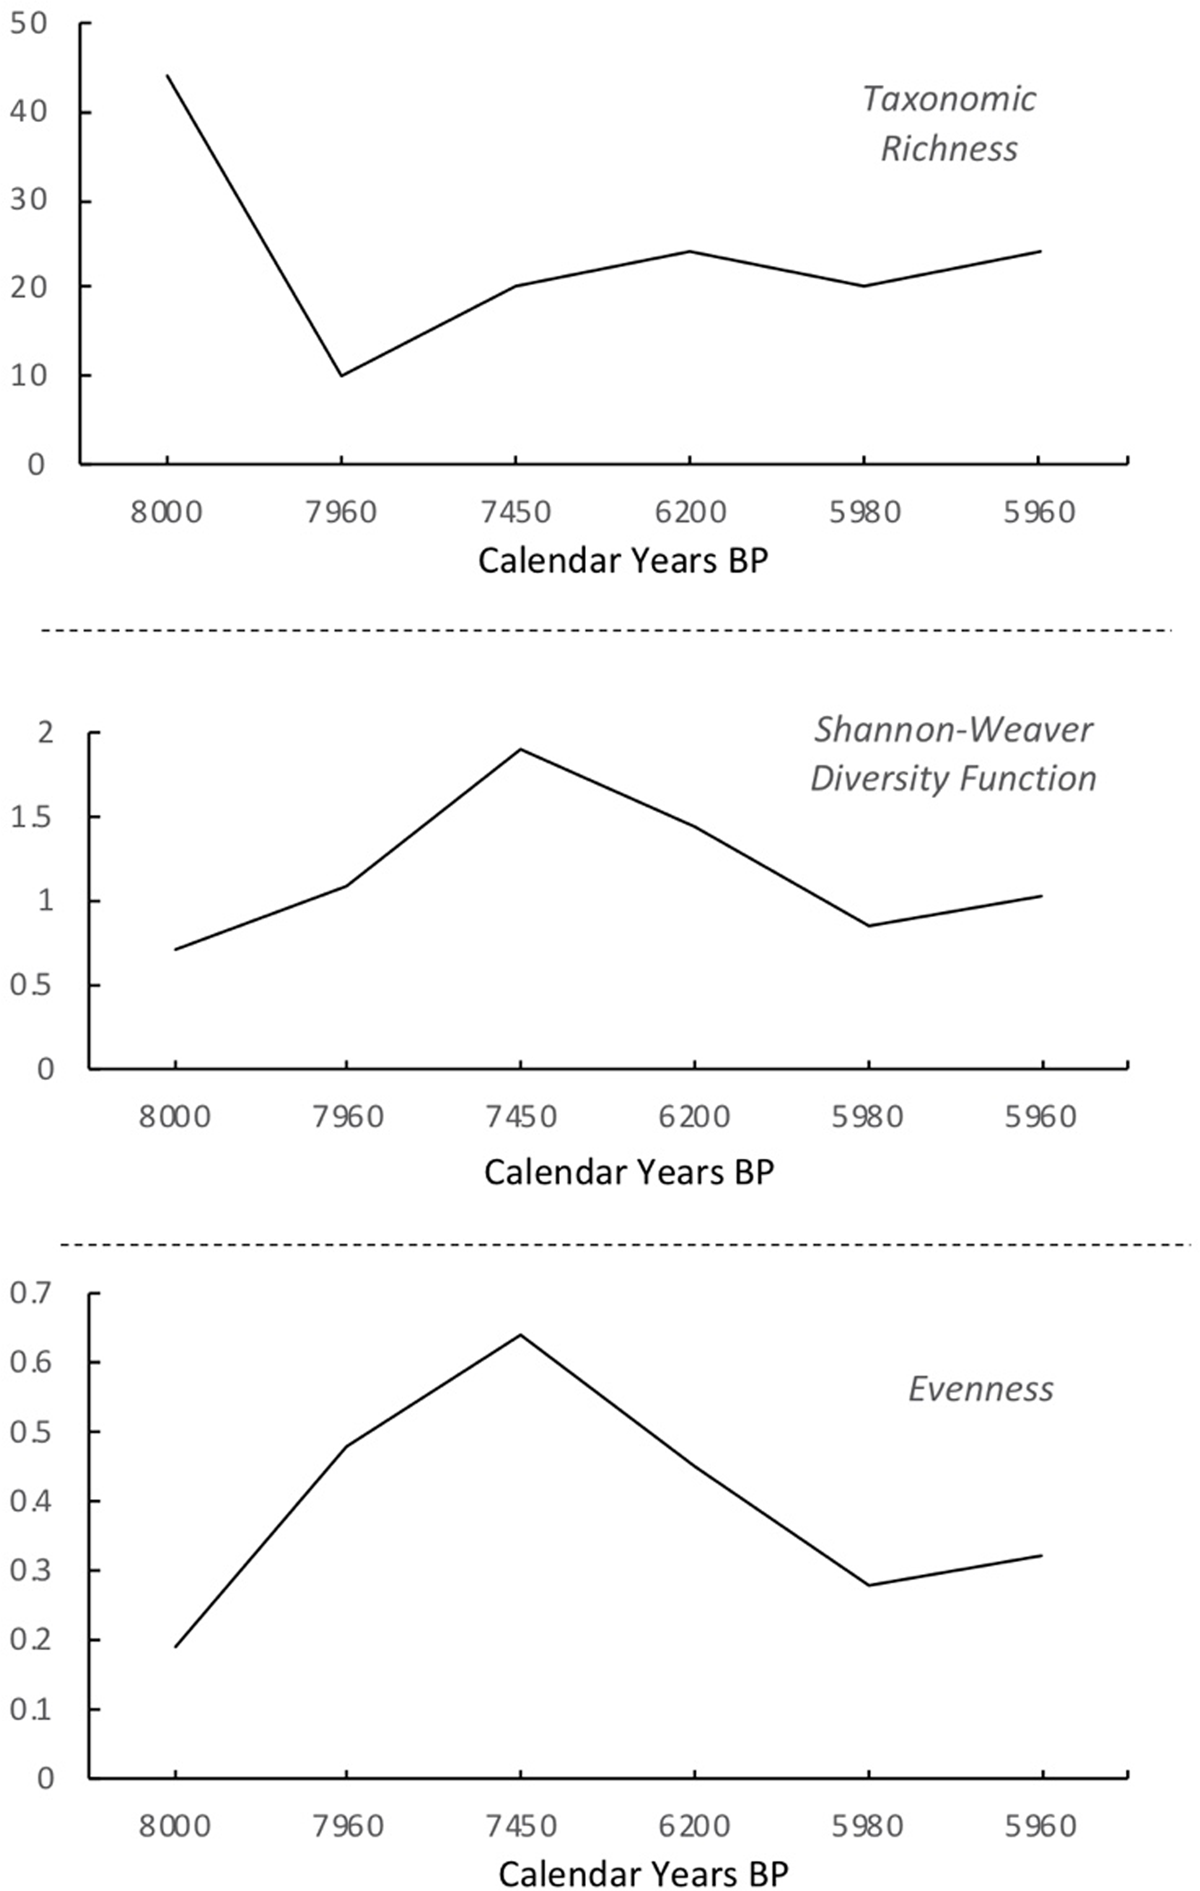
Figure 5
Taxonomic richness, diversity, and evenness for six archaeological sites on eastern Santa Rosa Island with estuarine shellfish collecting from 8000–5960 cal BP (see Table S3 for raw data and references).
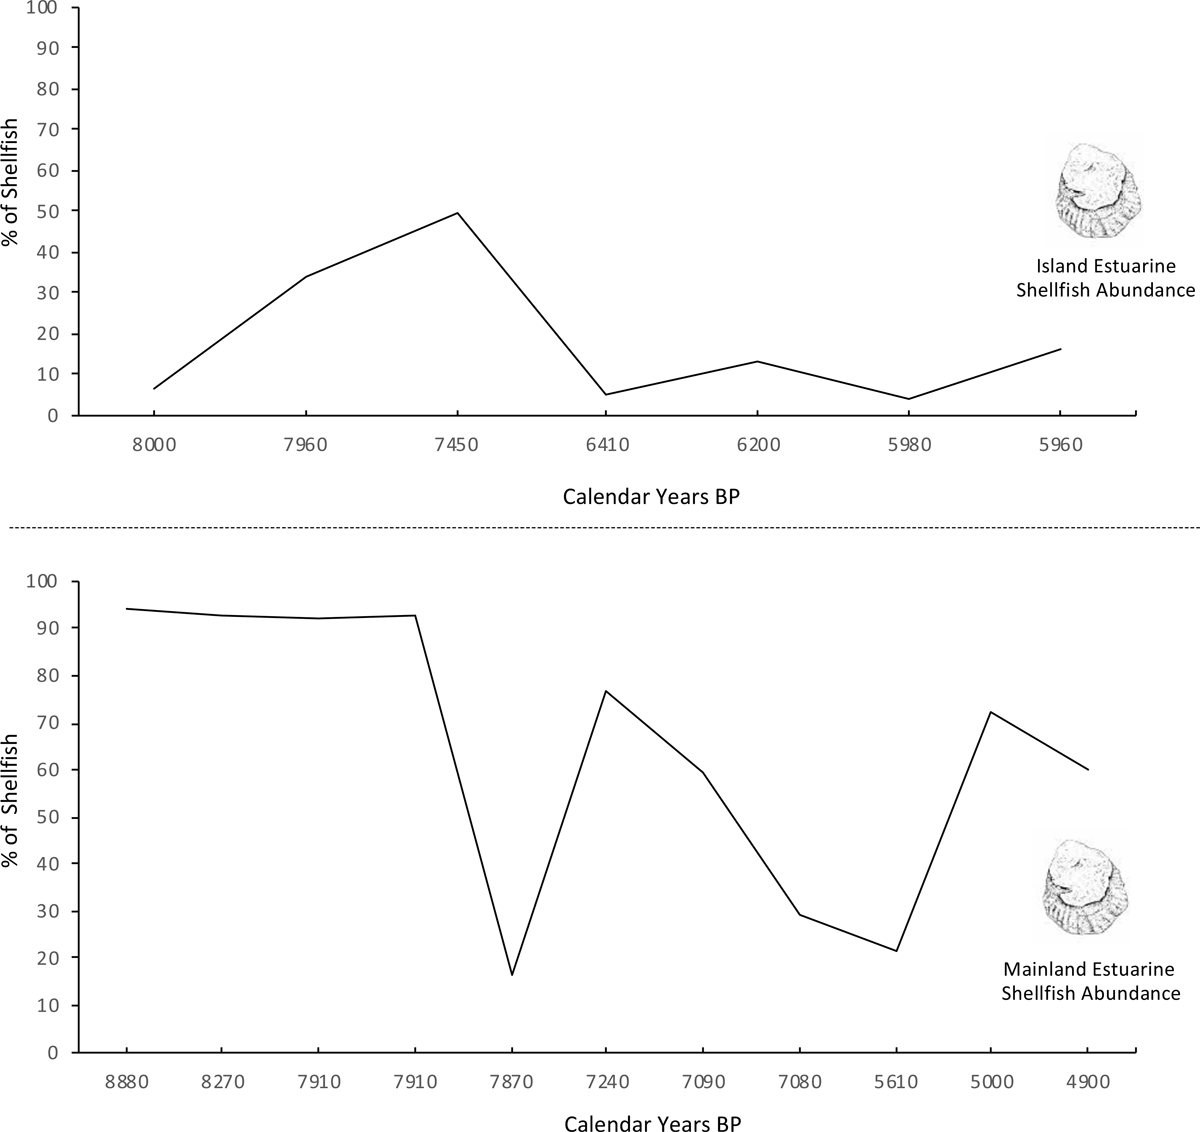
Figure 6
Abundance of estuarine shellfish as a percentage of total shell weight (excluding terrestrial and undifferentiated shell) at island (top) and mainland (bottom) sites from ~8000–5960 cal BP on the islands and ~8880–4900 cal BP on the mainland (see Tables S3 and S4 for raw data and references).
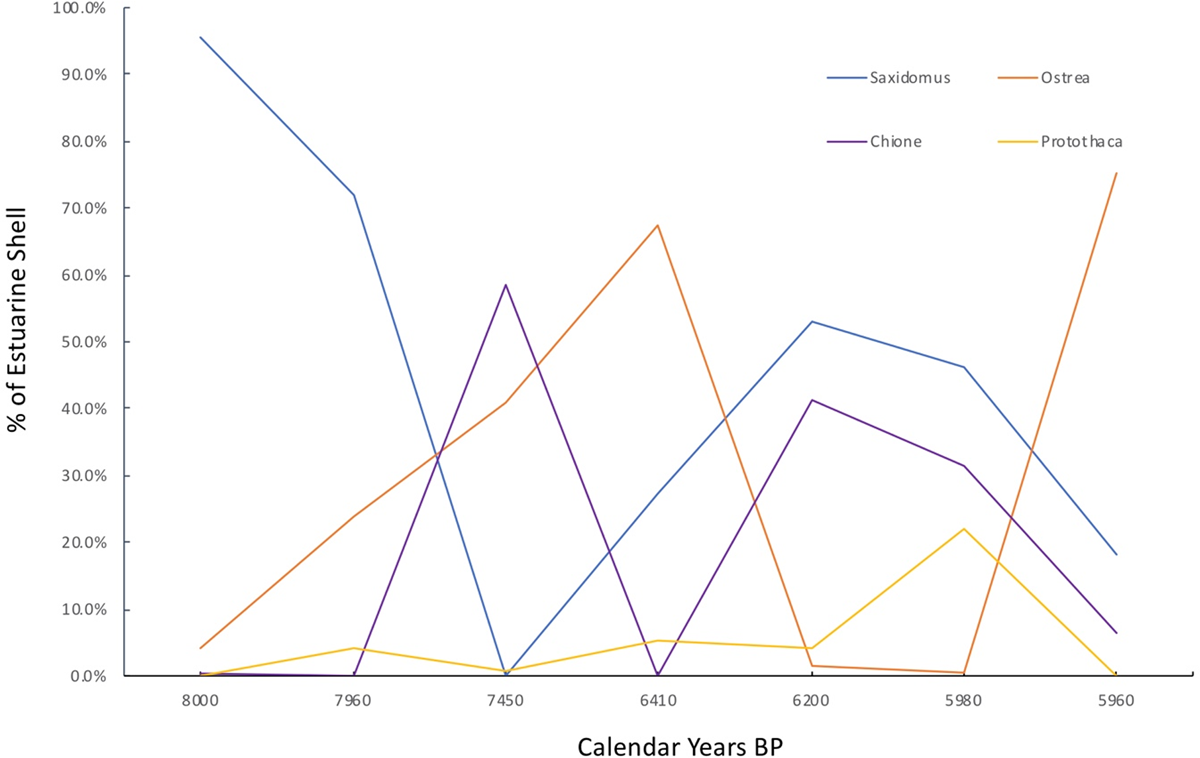
Figure 7
Changes in the abundance of estuarine shellfish at seven Abalone Rocks Site Components. These data compare just the abundance of estuarine shellfish taxa, showing fluctuations in each taxa through time relative to one another. Note widespread variation in the abundance in specific taxa through time. See Table S5 for raw data.