

Figure 1
Grassridge shelter (star) and relevant other archaeological sites in relation to modern vegetation bioregions (Mucina & Rutherford 2006); the inset shows the approximate locations of the Drakensberg Mountains (DM), the Orange River Scheme area (OR), the Cederberg Mountains (CM), and the Cradle of Humankind (CH). Figure produced by Christopher Ames.
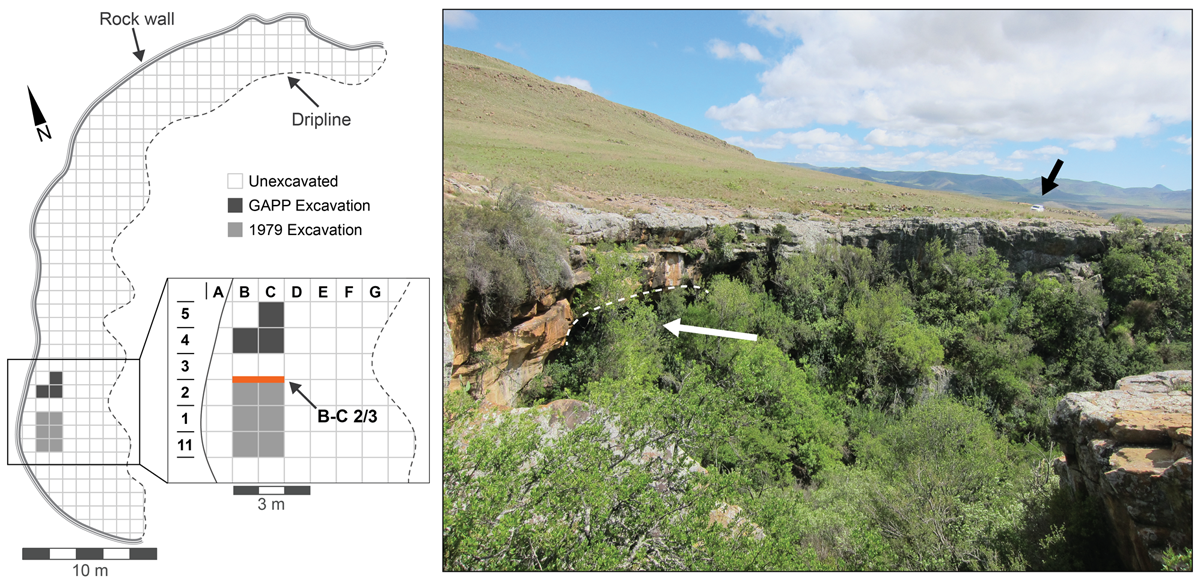
Figure 2
Plan of Grassridge shelter identifying the location of profile B-C 2/3 (bold orange line) and a photo of Grassridge shelter looking to the north; the dashed white line is the approximate location of the overhang and the white arrow points to the opening behind the vegetation (note vehicle—black arrow). Figure produced by Christopher Ames. Photo credit: GAPP 2014.
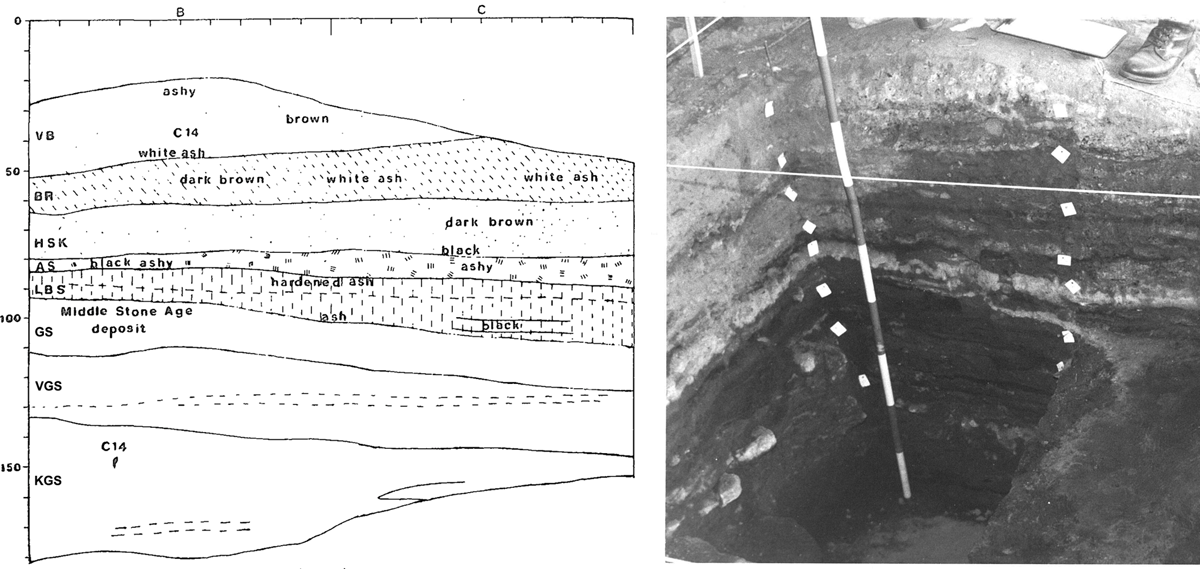
Figure 3
Stratigraphic drawing (scale in cm; modified from Opperman 1984: Figure 3) and photo of the B-C 2/3 profile from the 1979 Excavation at Grassridge. Photo credit: H. Opperman 1979; reproduced with permission.
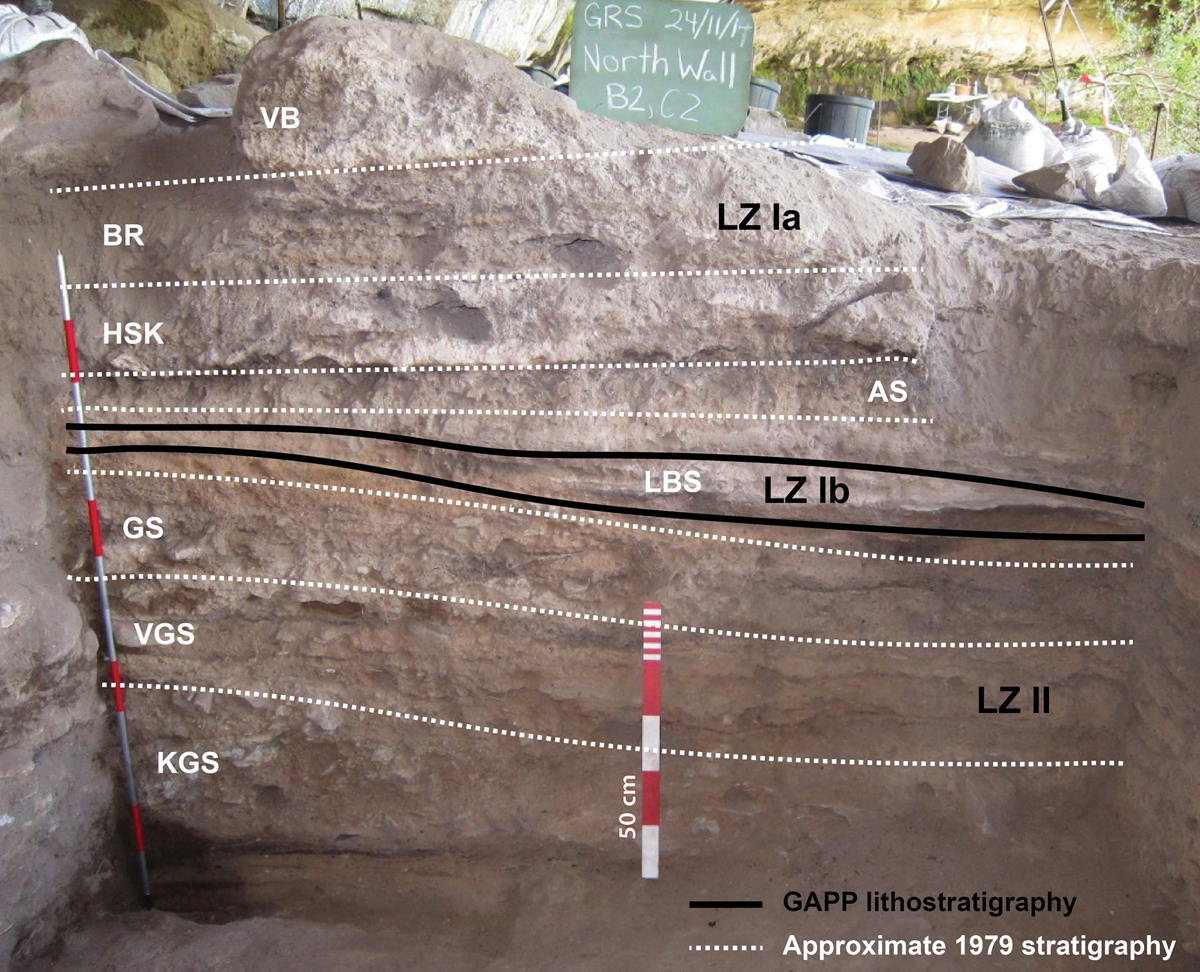
Figure 4
Photograph of the B-C 2/3 stratigraphic sequence with overlay of 1979 divisions and GAPP lithostratigraphic zones (large red segments of scale bars are 10 cm). Figure produced by Christopher Ames. Photo credit: GAPP 2014.
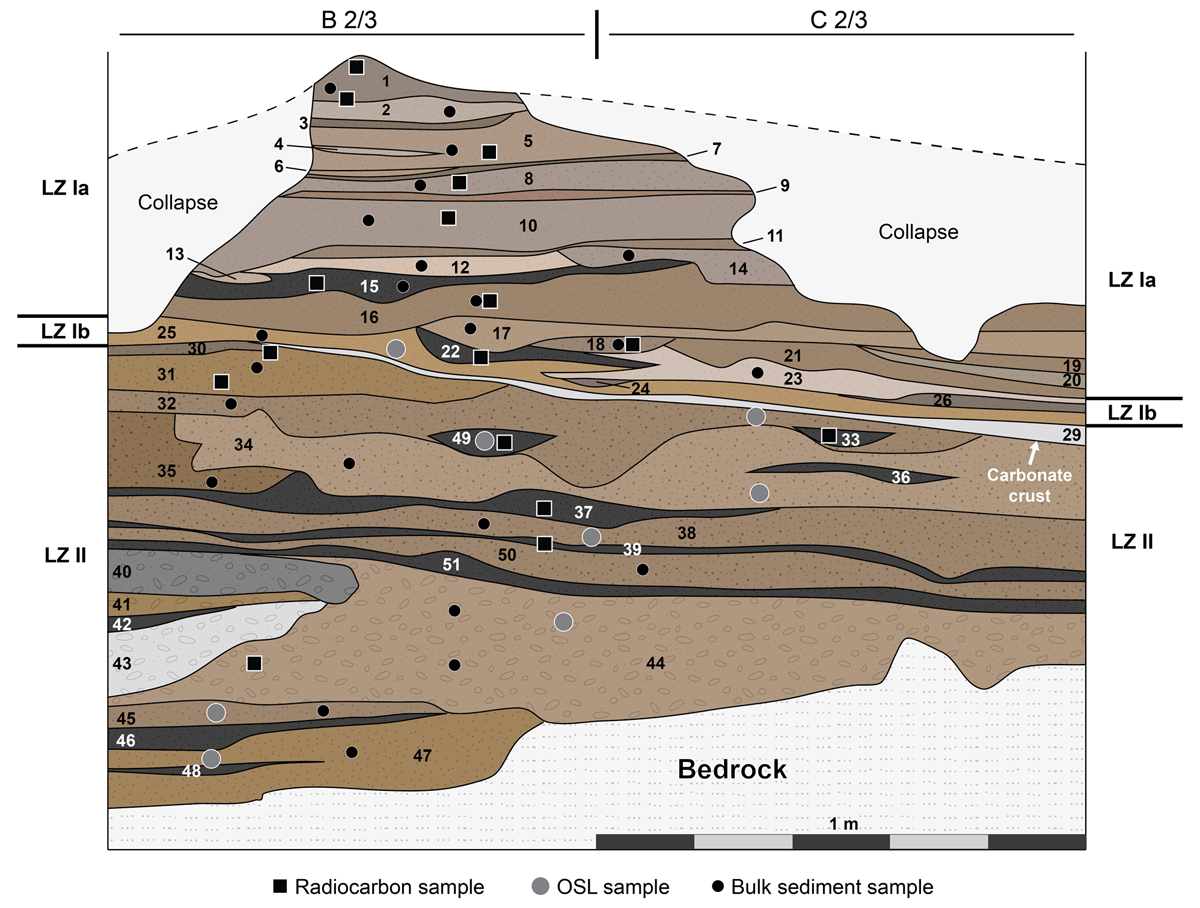
Figure 5
GAPP stratigraphic drawing of the B-C 2/3 profile showing numbered stratigraphic units, lithostratigraphic zones, and sample locations. Figure produced by Christopher Ames.
Table 1
Stratigraphic descriptions following the 1979 excavation (Opperman 1988, 1987, 1984) in relation to the lithostratigraphic zones defined during reanalysis (see Supplementary file 2 for more detail).
| 1979 Stratigraphic Divisions | GAPP Stratigraphic Units | GAPP Lithostratigraphic Zones | ||
|---|---|---|---|---|
| VB | Compact brown ashy loam | 1, 2, 3 | Ia | A sequence of horizontal fine sandy silts, alternating between 5–10 cm thick layers of grey, ashy, artefact-rich sediment and thin (1–3 cm) rubefied layers. Individual layer boundaries are clear to gradual. Within this zone is a 2–5 cm thick massive, creamy white ash layer that sits atop a 3–5 cm thick loose, charcoal-rich layer. The lower boundary of the zone is abrupt. Artefacts are abundant throughout, including lithics, ochre, and shell, but dominated by burnt and calcined bone fragments. |
| BR | Loose very dark sandy loam mixed with patches of white ash | 5, 4, 6, 7, 8, 9 | ||
| HSK | Dark brown sand with abundant faunal remains, lithics, and charcoal with the highest frequency of formal tools | 10, 11, 14, 12, 13 | ||
| AS | Thin layer of loose, fine, ashy sands with greater artefact frequency than LBS | 15 and part of 16 | ||
| LBS | Dark brown to black fine sandy layer with the top and bottom consisting of hardened ash horizons and containing relatively little cultural material | part of 16 and 17, 18, 19, 20, 21 | ||
| 22, 23, 24, 26, 25 | Ib | A thin horizontal yellowish brown fine sandy silt layer containing a 1–5 cm thick and 1 m wide deposit of massive, creamy white ash intercalated with a charcoal-rich lens. Rubification of the fine sandy silts underlying this combustion feature is noted. The lower boundary slopes toward the dripline and is demarcated by an unconformity. All artefact types are present, but in lower frequency than the overlying zone. | ||
| 29, 30, 33 and part of 31, 32, 34 | II | Gently sloping dark brown to dark yellowish brown silty fine sands supporting frequent small to medium size gravels. The top of the sequence is marked by a 1–3 cm thick carbonate crust, which is weakly laminated and thickest toward the dripline. Charcoal-rich stringers (1–3 cm thick) are common, with some spanning the width of the profile. Multiple clearly defined charcoal-rich lenses are also present, and there is a wedge of deposit with more common and larger gravels at the western edge of the profile. The base of the sequence rests on bedrock. Stone artefacts occur in similar frequency as the overlying zone, but faunal remains are extremely rare. | ||
| GS | Compact brown sand with much higher frequency of lithics than the underlying layers, but bone fragments are rare | Part of 31, 32, 34, and 49, 36, 35 | ||
| VGS | Light brown sand with similar cultural remains as KGS, but fewer bone fragments | 37, 38, 39, 50, 51 | ||
| KGS | Hardened brown sand overlying bedrock containing lithics, charcoal pieces, and bone fragments | 40, 41, 42, 43, 44, 45, 46, 47, 48 |
Table 2
Conventional and calibrated 14C age estimates on charcoal from the B-C 2/3 sequence (LZ = lithostratigraphic zone; SU = stratigraphic unit). Age calibrations with OxCal v 4.2.3 (Bronk Ramsey & Lee 2013) using the SHCal13 (Hogg et al. 2013) calibration curve.
| Sample Code | GAPP LZ | GAPP SU | 1979 Layer | Conventional 14C a BP | k cal a BP (95.4%) | x̅ age k cal a BP | Reference |
|---|---|---|---|---|---|---|---|
| UCI-209041 | Ia | 1 | VB* | 6015 ± 15 | 6.89–6.74 | 6.81 | this paper |
| UCI-209042 | Ia | 1 | VB* | 6040 ± 15 | 6.91–6.75 | 6.84 | this paper |
| Pta-2970 | Ia | 3* | VB | 6090 ± 80 | 7.16–6.72 | 6.92 | Opperman, 1984 |
| UCI-209043 | Ia | 5 | BR* | 6085 ± 15 | 6.96–6.80 | 6.89 | this paper |
| UCI-209044 | Ia | 8 | BR* | 6100 ± 15 | 6.99–6.80 | 6.91 | this paper |
| CAMS-170784 | Ia | 10 | HSK* | 6200 ± 35 | 7.17–6.94 | 7.06 | Collins et al., 2017 |
| UCI-209045 | Ia | 15 | HSK* | 6355 ± 25 | 7.31–7.17 | 7.23 | this paper |
| Beta-532051 | Ia | 16 | AS* | 6470 ± 30 | 7.42–7.23 | 7.36 | this paper |
| Beta-532052 | Ia | 18 | AS* | 6360 ± 30 | 7.32–7.17 | 7.24 | this paper |
| CAMS-170783 | Ib | 22 | LBS* | 10125 ± 50 | 12.0–11.4 | 11.6 | Collins et al., 2017 |
| UCI-209046 | II | 30 | LBS* | 24170 ± 190 | 28.6–27.8 | 28.2 | this paper |
| UCI-209047 | II | 31 | LBS* | 32120 ± 240 | 36.5–35.4 | 36.0 | this paper |
| UCI-209048 | II | 49 | GS* | 32710 ± 260 | 37.6–36.0 | 36.7 | this paper |
| UCI-209049 | II | 37 | VGS* | 33830 ± 300 | 38.9–37.2 | 38.2 | this paper |
| UCI-209050 | II | 39 | VGS* | 34720 ± 330 | 40.0–38.5 | 39.2 | this paper |
| CAMS-169741 | II | 33 | LBS* | 35000 ± 2200 | 45.3–35.1 | 40.0 | Collins et al., 2017 |
| Pta-2714 | II | 44 | KGS | 36380 ± 870 | 42.4–39.4 | 40.9 | Opperman, 1984 |
[i] * Best approximation based on the identification of Opperman’s layers during stratigraphic reanalysis.
Table 3
Dose rate data for OSL samples from the B-C 2/3 sequence (see Supplementary file 1 for more detail).
| Sample | Measured water content* | Gamma (Gy/ka)** | Beta (Gy/ka) | Cosmic (Gy/ka) | Total (Gy/ka)*** |
|---|---|---|---|---|---|
| GRS 1 | 15.3 | 0.56 ± 0.02 | 0.89 ± 0.05 | 0.03 ± 0.00 | 1.51 ± 0.09 |
| GRS 6 | 15.2 | 0.84 ± 0.02 | 1.31 ± 0.07 | 0.03 ± 0.00 | 2.21 ± 0.13 |
| GRS 7 | 12.9 | 0.90 ± 0.02 | 1.36 ± 0.07 | 0.02 ± 0.00 | 2.32 ± 0.13 |
| GRS 8 | 10.4 | 0.88 ± 0.02 | 1.43 ± 0.07 | 0.02 ± 0.00 | 2.36 ± 0.14 |
| GRS 9 | 7.5 | 0.82 ± 0.03 | 1.15 ± 0.06 | 0.02 ± 0.00 | 2.02 ± 0.12 |
| GRS 11 | 20.9 | 0.57 ± 0.01 | 0.90 ± 0.05 | 0.03 ± 0.00 | 1.53 ± 0.09 |
| GRS 12 | 6.1 | 0.69 ± 0.02 | 1.07 ± 0.05 | 0.03 ± 0.00 | 1.82 ± 0.11 |
| GRS 13 | 8.8 | 0.73 ± 0.02 | 1.14 ± 0.05 | 0.03 ± 0.00 | 1.92 ± 0.11 |
[i] * Ages calculated using a water content of 12.1 ± 4.0%.
** GRS 9 gamma dose rate includes contribution from underlying bedrock (8 cm below).
*** Includes an internal contribution of 0.03 ± 0.01 Gy/ka.
Table 4
Equivalent dose and age data for OSL samples from the B-C 2/3 sequence. (LZ = lithostratigraphic zone; SU = stratigraphic unit)
| Sample | GAPP LZ | GAPP SU | 1979 Layer | Grain size (μm) | n= | OD (%) | Age Model | FMM OD | De (Gy) | Age (ka) |
|---|---|---|---|---|---|---|---|---|---|---|
| GRS 1 | Ib | 25 | LBS | 180–212 | 81 | 27 ± 4 | CAM | 20.3 ± 0.9 | 13.5 ± 1.0 | |
| GRS 12 | II | 32 | LBS | 150–180 | 168 | 49 ± 3 | FMM, k = 2 | 38 | 57.6 ± 2.7 | 31.6 ± 2.5 |
| GRS 13 | II | 34 | GS | 150–180 | 82 | 42 ± 5 | CAM | 65.9 ± 3.8 | 34.3 ± 2.9 | |
| GRS 6 | II | 38 | VGS | 180–212 | 69 | 50 ± 7 | CAM | 76.1 ± 6.5 | 34.4 ± 3.6 | |
| GRS 7 | II | 44 | KGS | 180–212 | 60 | 50 ± 9 | CAM | 81.9 ± 8.2 | 35.3 ± 4.1 | |
| GRS 8 | II | 45 | KGS | 150–180 + 180–212 | 84 | 45 ± 6 | CAM | 86.0 ± 6.1 | 36.4 ± 3.4 | |
| GRS 11 | II | 32/49 | GS | 150–180 | 144 | 34 ± 3 | CAM | 57.5 ± 1.9 | 37.6 ± 2.6 | |
| GRS 9 | II | 47 | KGS | 180–212 | 65 | 89 ± 10 | FMM, k = 2 | 58 | 87.2 ± 8.0 | 43.1 ± 4.8 |
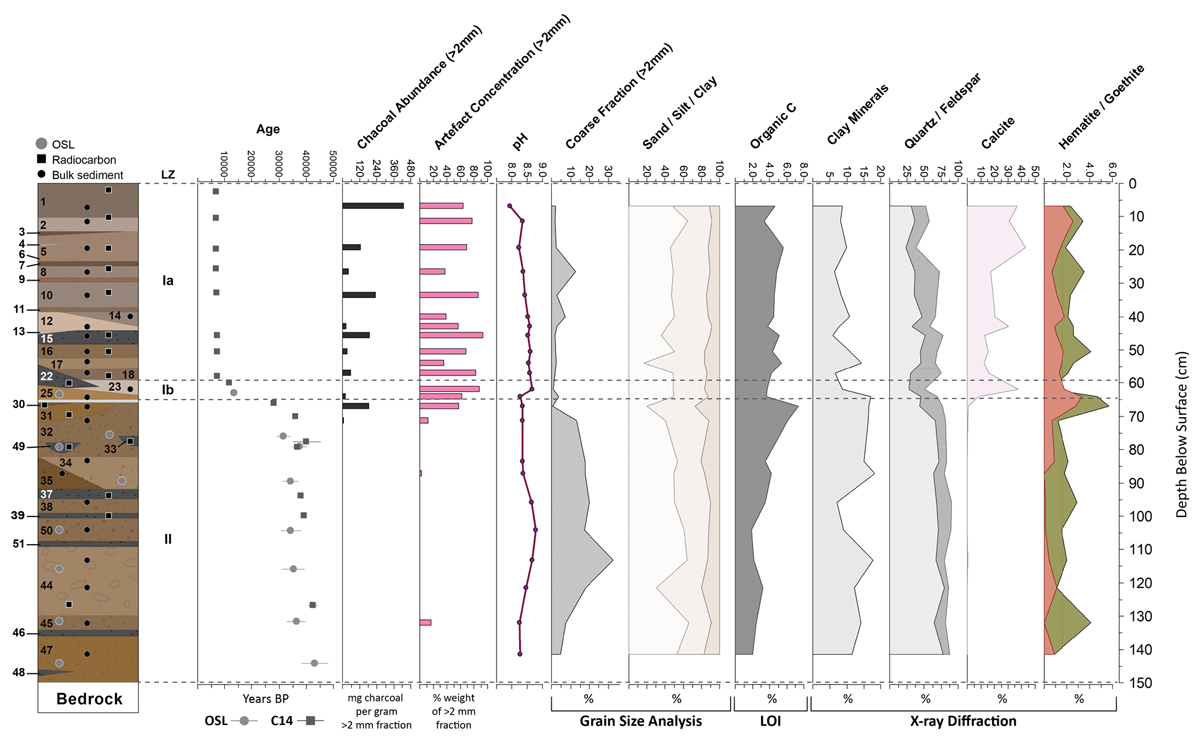
Figure 6
Schematic of the Grassridge sequence with geochronological results and sedimentological properties. Figure produced by Christopher Ames.
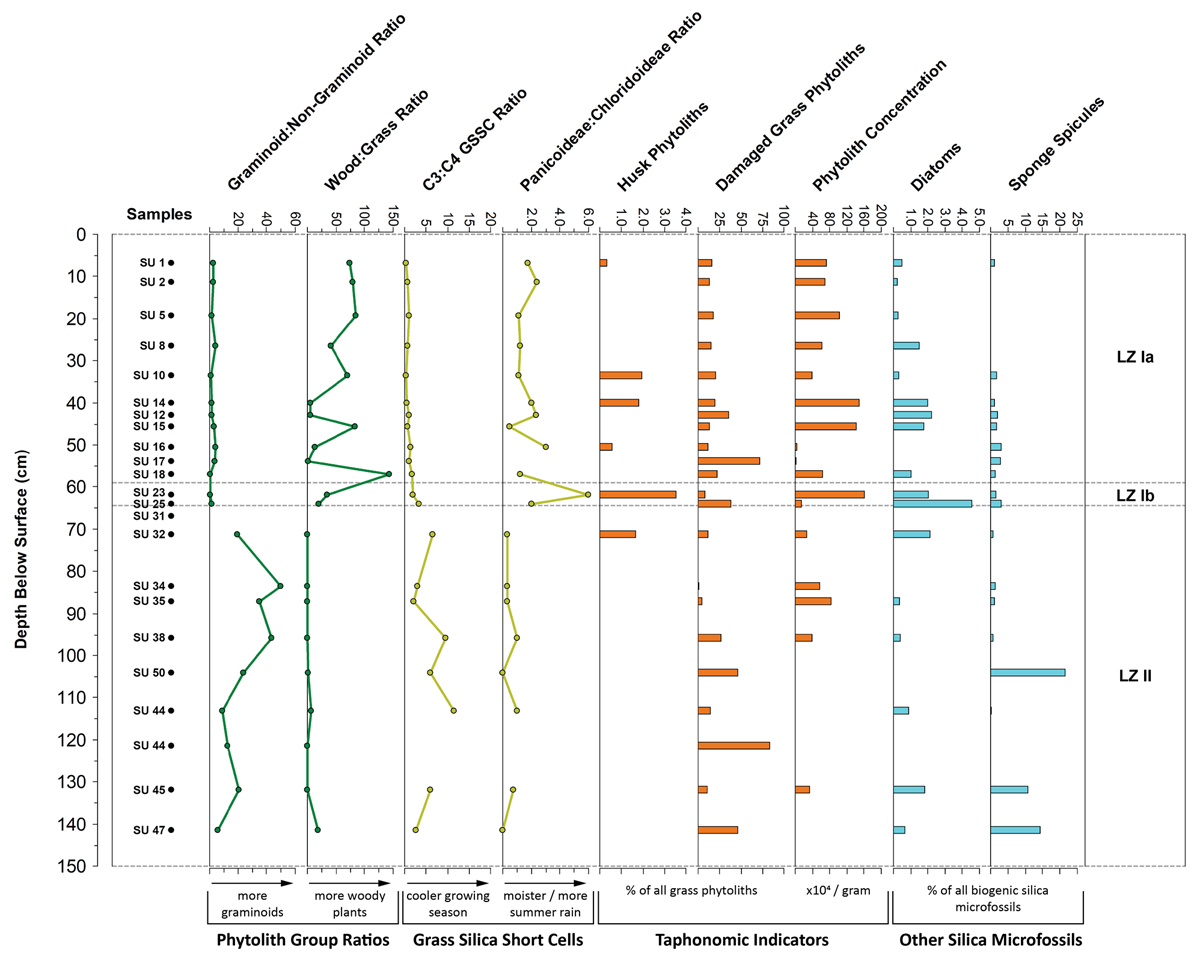
Figure 7
Stratigraphic presentation of phytolith ratios and taphonomic indicators, as well as the proportions of recovered diatoms and sponge spicules. Figure produced by Christopher Ames.