
Figure 1
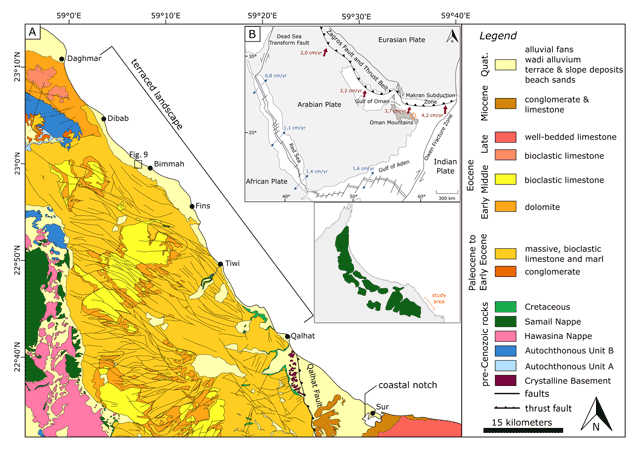
Geology of the study area. (A) Study area on the north-eastern coast of Oman with the Qalhat Fault in the south, separating the terraced landscape from the Sur area. Geological map simplified after Al Battashy et al. (2001); El Amin et al. (2005); Le Métour, de Gramont & Villey (1986); Wyns et al. (1992). (B) Plate tectonic setting after Hoffmann et al. (2016); Vita-Finzi (2001). (C) Extent of the Samail Ophiolite after Searle (2007).
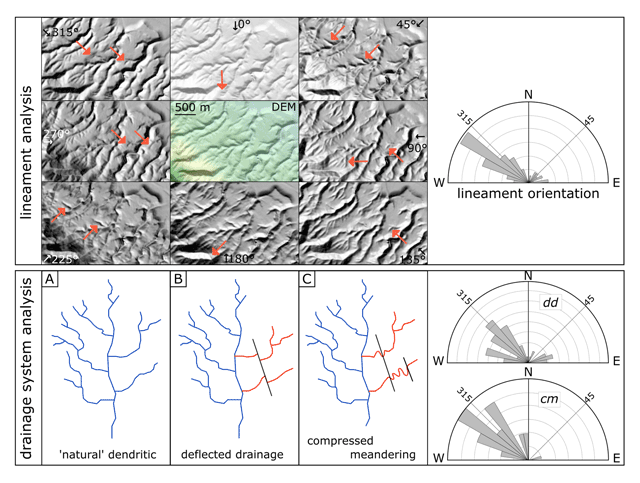
Figure 2
Lineament and drainage system analyses. Lineament analysis (top): The digital elevation model in the center, surrounded by relief shading models for eight different illumination angles which are noted for each model. Orange arrows point perpendicular to lineaments. The rose diagram shows a dominant lineament orientation roughly striking NW-SE. Drainage system analysis (bottom): The natural dendritic drainage pattern (A) and the most common drainage anomalies resulting by fault zones: deflected drainage (B) and compressed meandering (C). The rose diagrams show the directions of the detected drainage anomalies (dd = deflected drainage; cm = compressed meandering).

Figure 3
Structure map of the study area. Structure map of the area between Daghmar and Tiwi, showing both the digital and field results and a rose diagram of all detected faults. (A), (B), (C): Examples for faults in different dimensions detected in the field, the location of each fault is noted on the map. The location of the photography in Figure 5 is located as well.
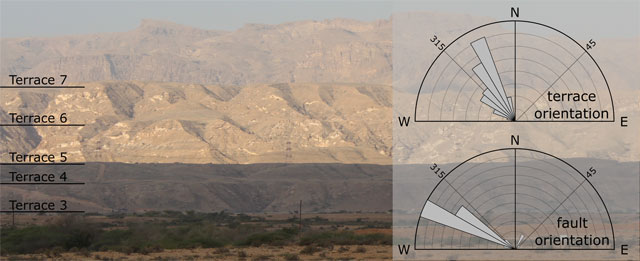
Figure 4
Terraces and rose diagrams of the detected faults and terraces. The dissenting directions confirm that the terraces do not represent fault surfaces and are merely of conventional marine terrace origin. The location of the photography is marked in Figure 4.
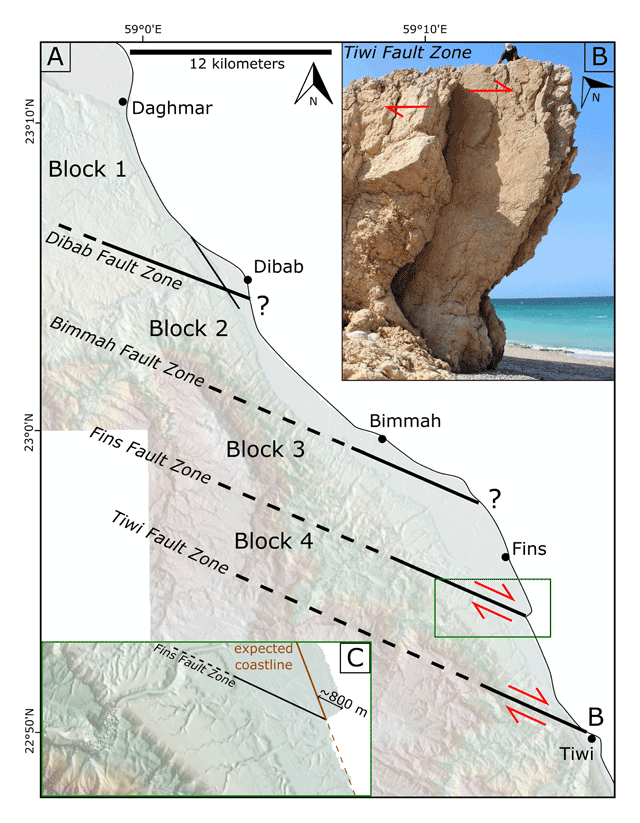
Figure 5
Model for the displacement of tectonic blocks relative to each other. The topography is displayed in the background, as it also supports this theory. An escarpment follows the course of the southernmost Tiwi Fault Zone. This zone also comprises the fault proving evidence for movement of the blocks relative to each other by slickensides on the fault surface shown in (B). These slickensides indicate a dextral movement. (C) The coastline south of Fins indicates a dextral movement direction as well and an offset of approximately 800 meters.
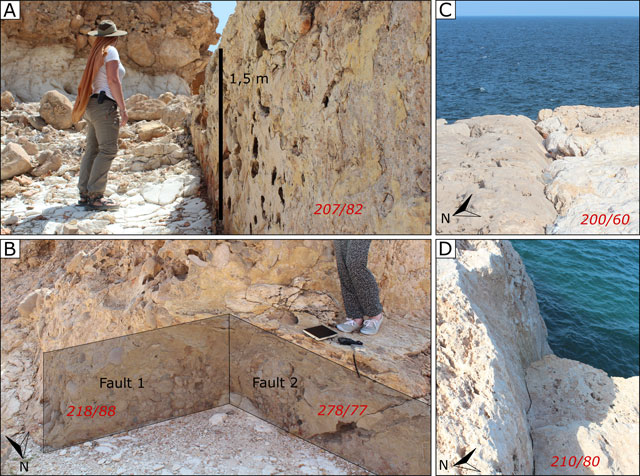
Figure 6
Faults and fissures along the coast. (A) and (B) Faults in the area around Dibab proving the youngest tectonic activity (Location: 23°04’N/59°02’E). The major fault (fault 1 and fault surface in (A)) is displaced by a younger fault (fault 2) by approximately 2 meters. The fault surfaces in (B) indicate two fault generations. Measurements are noted in red. (C) and (D): Small-scale fissures and fractures on the lowermost terrace near the coast, striking in the major fault direction and therefore indicating recent tectonic activity. These small-scale fractures can be found south of Tiwi (approximate location: 22°47’N/59°16’E).
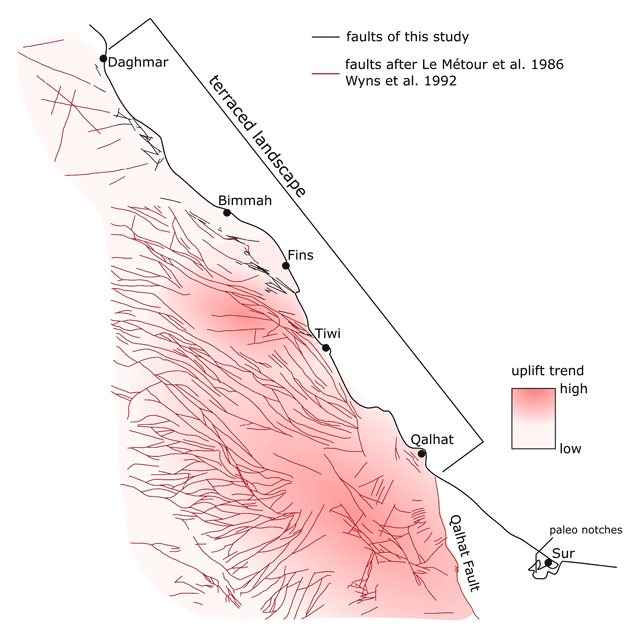
Figure 7
Radial fault pattern in the study area. The radial fault pattern derived by the geological maps after Le Métour, de Gramont & Villey (1986) and Wyns et al. (1992) indicate locally higher uplift rates induced by dome-like uprising of serpentinite.

Figure 8
Model for the terraced landscape from Daghmar in the NNW to Qalhat in the SSE. Four fault zones, the Dibab Fault Zone, Bimmah Fault Zone, Fins Fault Zone and Tiwi Fault Zone, divide the terraced area in four separated blocks. The Qalhat Fault represents the southern termination of this landscape, the block south of Qalhat is stable.
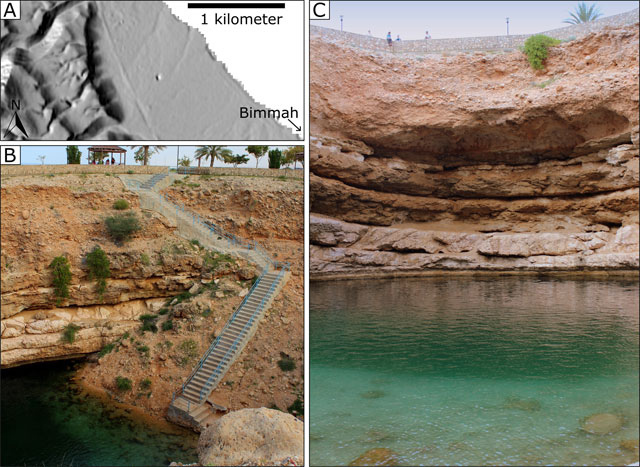
Figure 9
Example of karstification. The Bimmah sinkhole. (A) location of the sinkhole (dot in the centre) as depicted in the digital elevation model. (B) and (C) the stratigraphy exposed in the sinkhole shows Eocene limestone, overlain by deltaic Pleistocene deposits.