
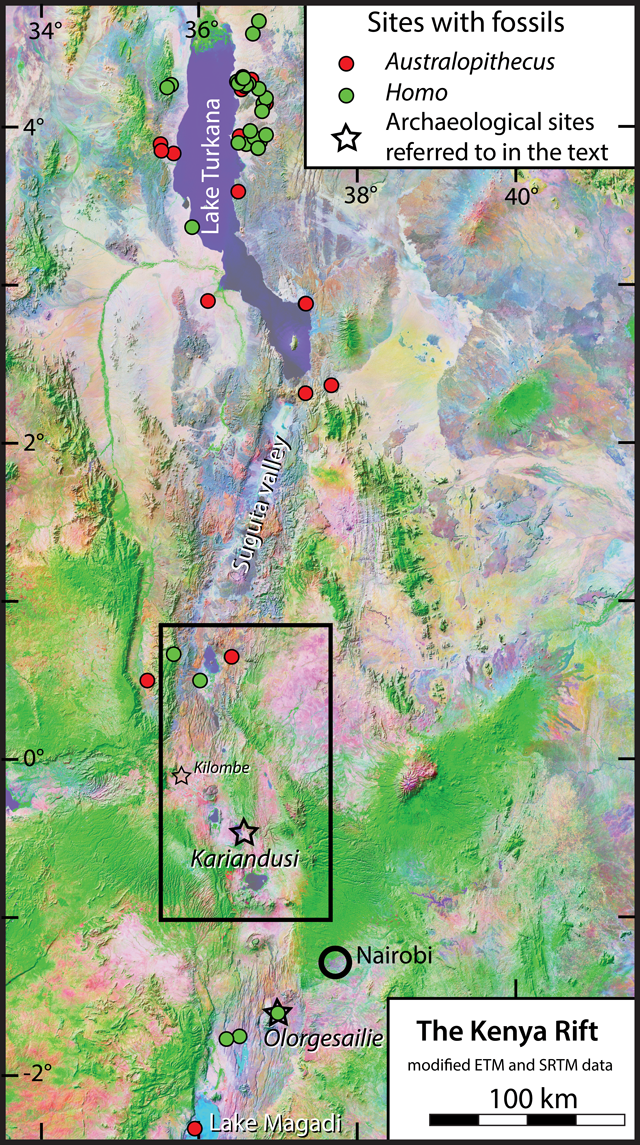
Figure 1
The Kenya Rift and surroundings, showing sites containing hominin fossils and selected archaeological sites referred to in the text. Fossil data are from the Paleobiology database (https://paleobiodb.org), and were downloaded on January 21, 2016 using taxa = Homo erectus, Homo habilis, Australopithecus; time interval = Pliocene through Pleistocene; and location = Kenya.
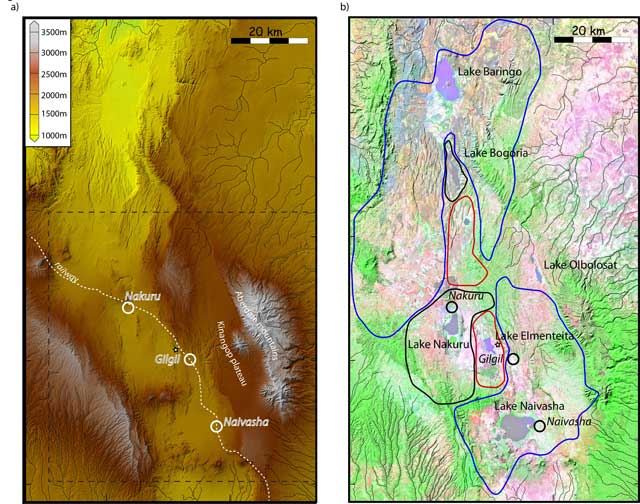
Figure 2
The Central Kenya Rift from Naivasha to Baringo. (a) Shaded relief illustrating that the landscape in many regions is topographically complex. (b) Modified ETM+ (Earth Thematic Mapper) image of the same region as (a). The many small lakes are identified with their catchments. Rivers within the rift are not shown. All rivers with their origin outside the rift drain away from it. Kariandusi site is indicated by a small star.
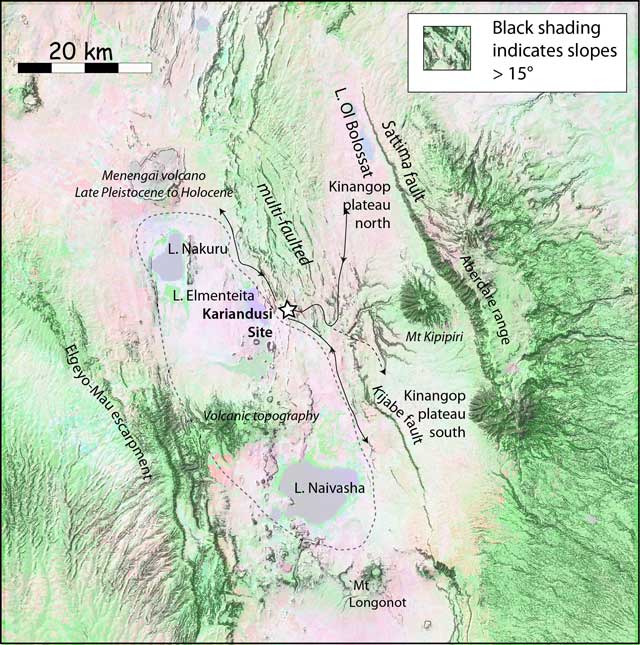
Figure 3
Morphology of the region including Lakes Nakuru, Elmenteita, Naivasha and Bolossat. Slopes greater than 15° are indicated by grey shading. Motor vehicles find such terrain difficult to cross without prepared roads, and large animals would have been restricted by similar factors. At times in the past, Lakes Nakuru, Elmenteita and possibly Naivasha have joined at times of high lake level indicated (See text). The outline is shown approximately by a dashed line. Some earlier features have been masked by volcanism between Elmenteita and Naivasha and around Menengai volcano and Mt. Longonot. See also Figure 4.
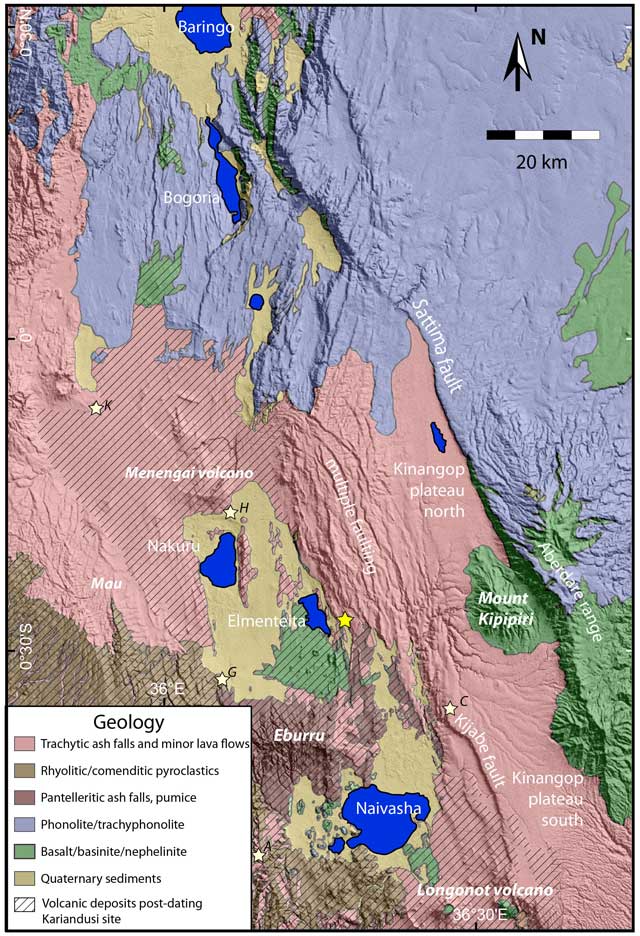
Figure 4
Geological map of the rift and flanks from Lake Naivasha to Lake Baringo. The Kariandusi site location is indicated by a star. Cross hatching indicates volcanic deposits c. 700ka – postdating the Kariandusi site (Bergner et al., 2009; Clarke et al., 1990; McCall, 1967; Scott & Skilling, 1999). Younger sites are indicated by small stars: H = Hyrax hill; G = Gamble’s cave; C = Cartwright’s site; E = Ekapune Ya Muto (Leakey, 1931; Leakey et al., 1943; Ambrose, 1998; Waweru, 2002).
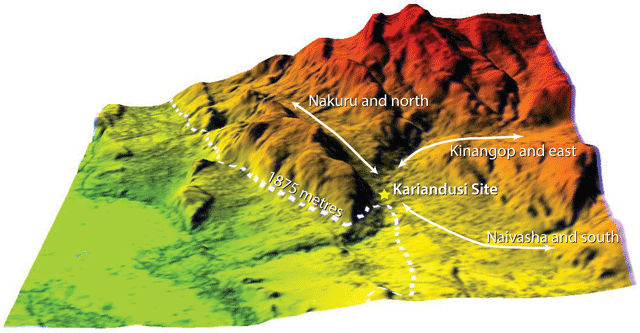
Figure 5
Routes for large animals when the level of Lake Elmenteita is high. Bergner et al. (2009) quote 1900m to be overall the highest level. Our observations suggest that at the Kariandusi site highest lake level should have been 10m lower. Lake levels of greater than 1875m completely block access along the lake-shore. For lower lake levels movements along the lake shore would have been straightforward and the lake sediments would also have provided good grazing or browsing. At high lake-levels, animals moving to or from Nakuru and the north would have to pass along a valley bounded by fault scarps and cliffs. The railway today follows this route. The artefacts indicate an ideal location for intercepting animals crossing the river, regardless of whether they are in primary position or were subsequently moved by fluvial action over distances which are in any case thought to be quite short (see text for discussion). The DEM used for this figure is a product of two World View 2 scenes processed with “Stereo Pipeline” software. Data was available through collaboration with Ryan Gold, USGS.
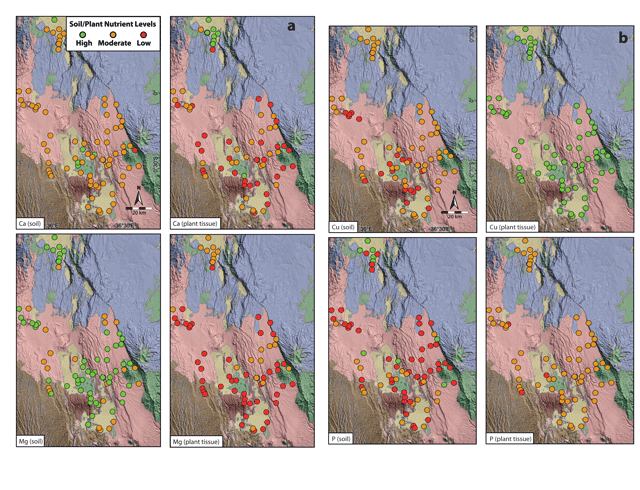
Figure 6
Maps showing the results for some important trace nutrients. The supplementary material (Table S1, Figure S2) contains complete data. The base map is shown in Figure 5, which also shows the Kariandusi site location. Not many soil and vegetation samples were taken on Phonolite or Trachyphonolite. The soils in these regions were not easy to access, vegetation was thin and there were few animals. (a) Sites of soil and plant material samples. The sample sites are colour-coded for Calcium (upper row) and Magnesium (lower row). Green indicates good or adequate mineral levels and red low levels. Orange shows intermediate levels. Information for latitude and longitude and a key are shown in the upper left figure. (b) Sites of soil and plant material samples. The sample sites are colour coded for Copper (upper row) and Phosphorus (lower row). Green indicates good or adequate mineral levels and red low levels. Orange shows intermediate levels. Information for latitude and longitude and a key are shown in the upper left panel of Figure 6a.
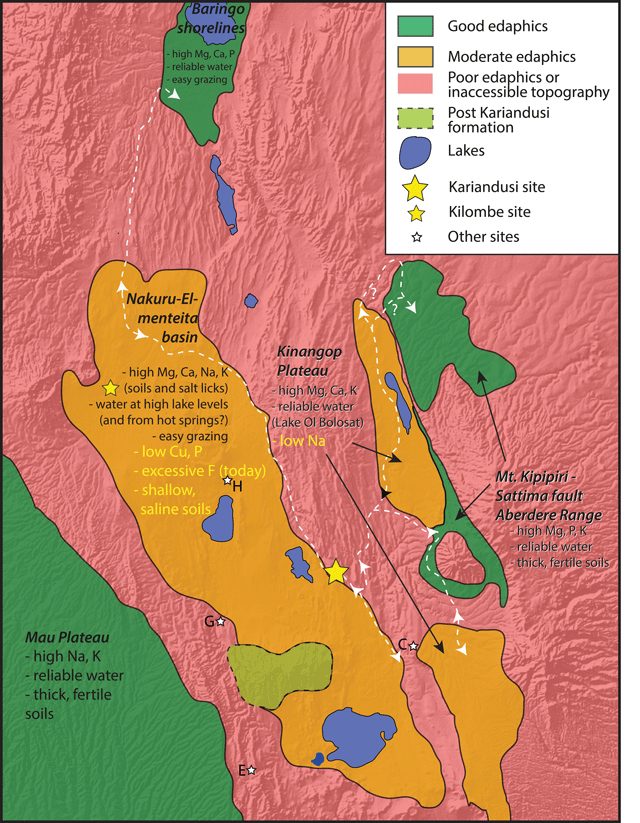
Figure 7
Edaphic sub-regions between Lake Naivasha and Lake Baringo. Areas of good edaphics attractive to animals are shown in green. Moderately good areas are indicated in orange. Elsewhere either the edaphics are very poor or topographic complexity makes the area inaccessible to large animals. Possible routes for animal movements are shown. At very high lake levels, large animals have to pass the Kariandusi site. At other times animal movements would have been less constrained and ambush hunting might not have been a viable way to access fat-rich protein.
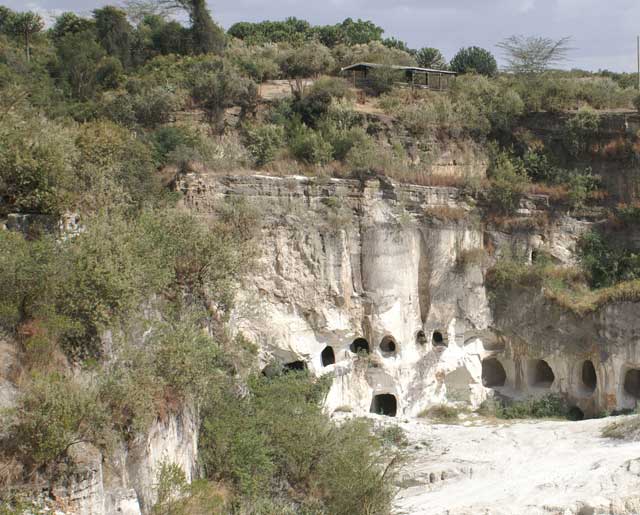
Figure 8
View of the Kariandusi site taken from the present-day valley floor looking east. The tin- roofed structure above the cliff marks the location of the John Gowlett excavation. Below it are thick accumulations of lake sediment that have been extensively quarried (Photo by G. Bailey February 2012).