
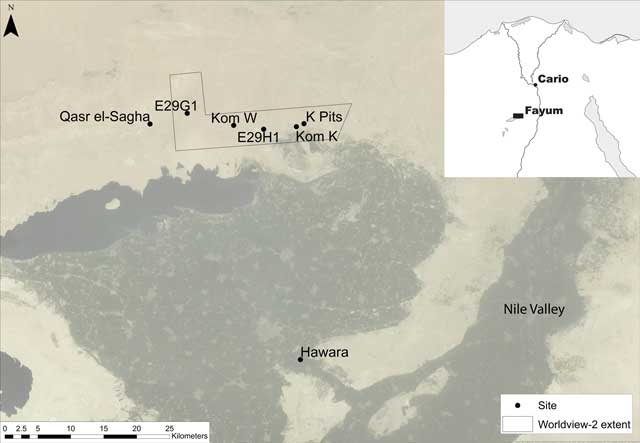
Figure 1
Fayum basin showing locations mentioned in text and the extent of the Worldview-2 DSM.
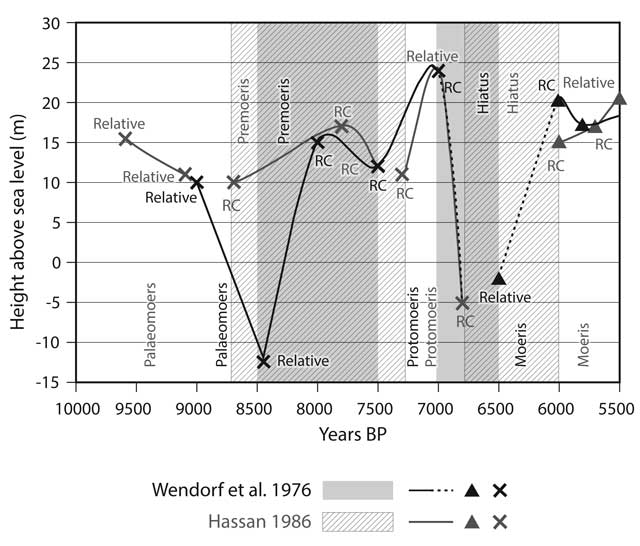
Figure 2
Early to Mid-Holocene models of lake level fluctuations (m asl) for Lake Qarun. Lake level changes from Wendorf and Schild (1976) and Hassan (1986). RC indicates a date from a radiocarbon determination. Relative indicates an age estimated from a stratified sample. Modified from Phillips 2013, figure 5.7.
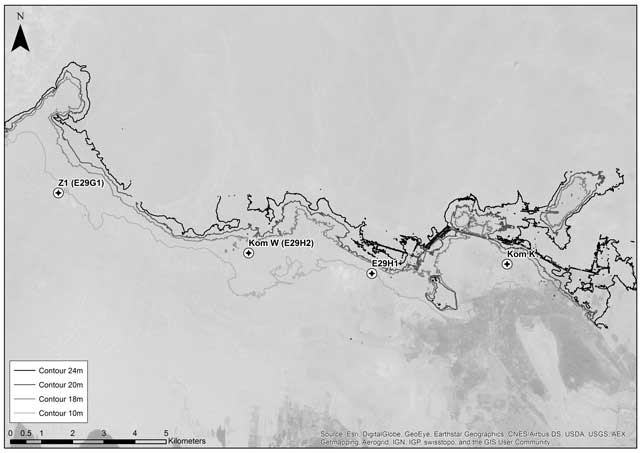
Figure 3
Fayum north shore 10 m, 18 m, 20 m, and 24 m contours from DSM 1 m data. Proposed lake advances above 10 m submerge the four sites indicated.
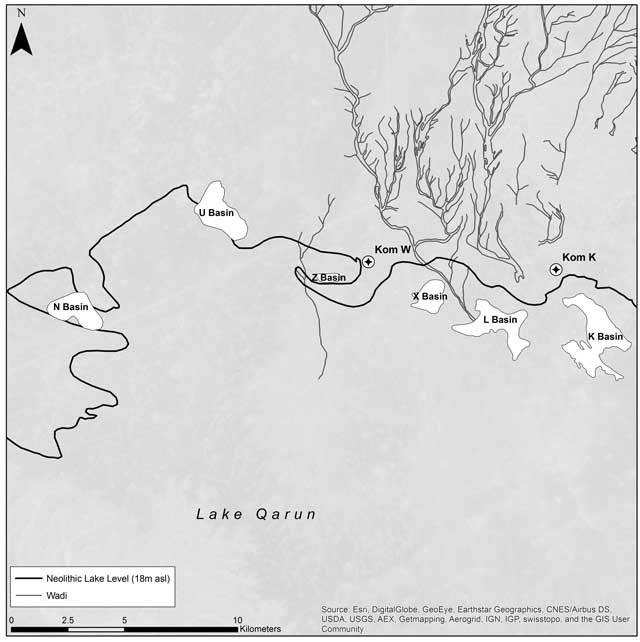
Figure 4
The wadis, basins and Neolithic lake edge (18 m asl) identified by Caton-Thompson and Gardner (1934).
Table 1
Slope change calculations for the north shore basins identified by Caton-Thompson and Gardner (1934).
| Basin | Degrees of slope change |
|---|---|
| Z | 65.07 |
| N | 32.36 |
| U | 29.37 |
| K | 19.48 |
| L | 18.27 |
| X | 16.99 |
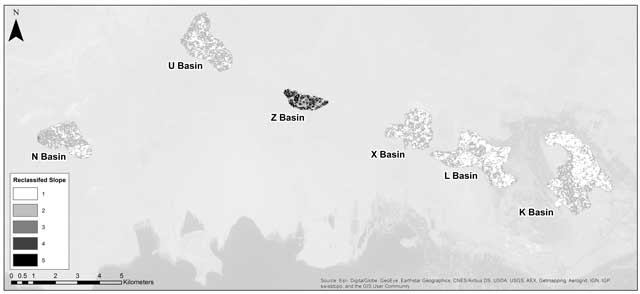
Figure 5
Reclassification of basin slope values based on the Parsons (1988) nine-unit model (see text for details).
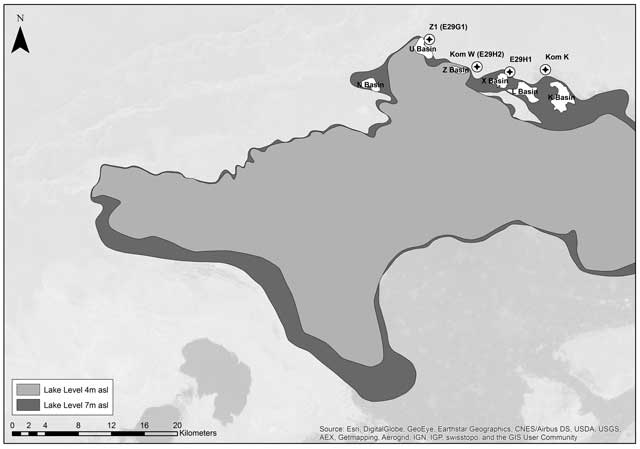
Figure 6
North shore Neolithic lake basin exposure and variability in this exposure associated with likely Nile inundation.