
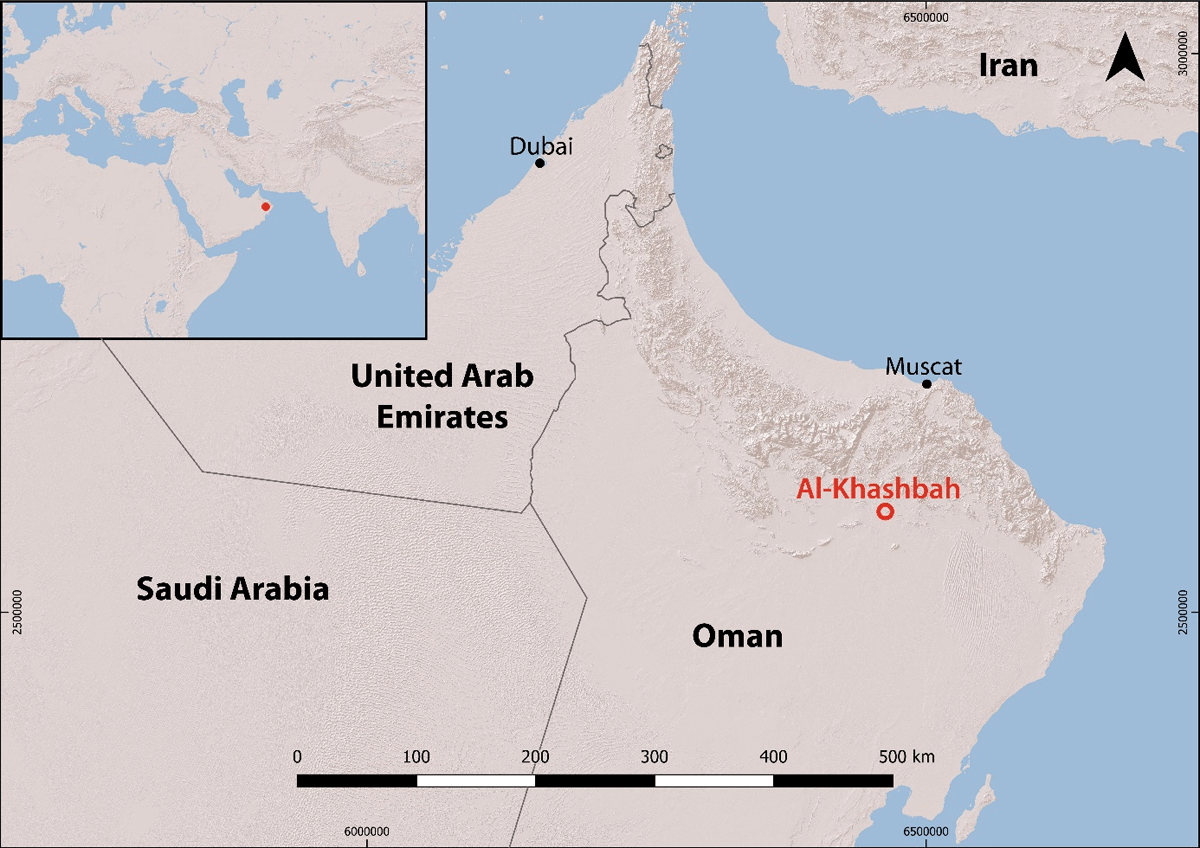
Figure 1
Location of Al-Khashbah, Sultanate of Oman.
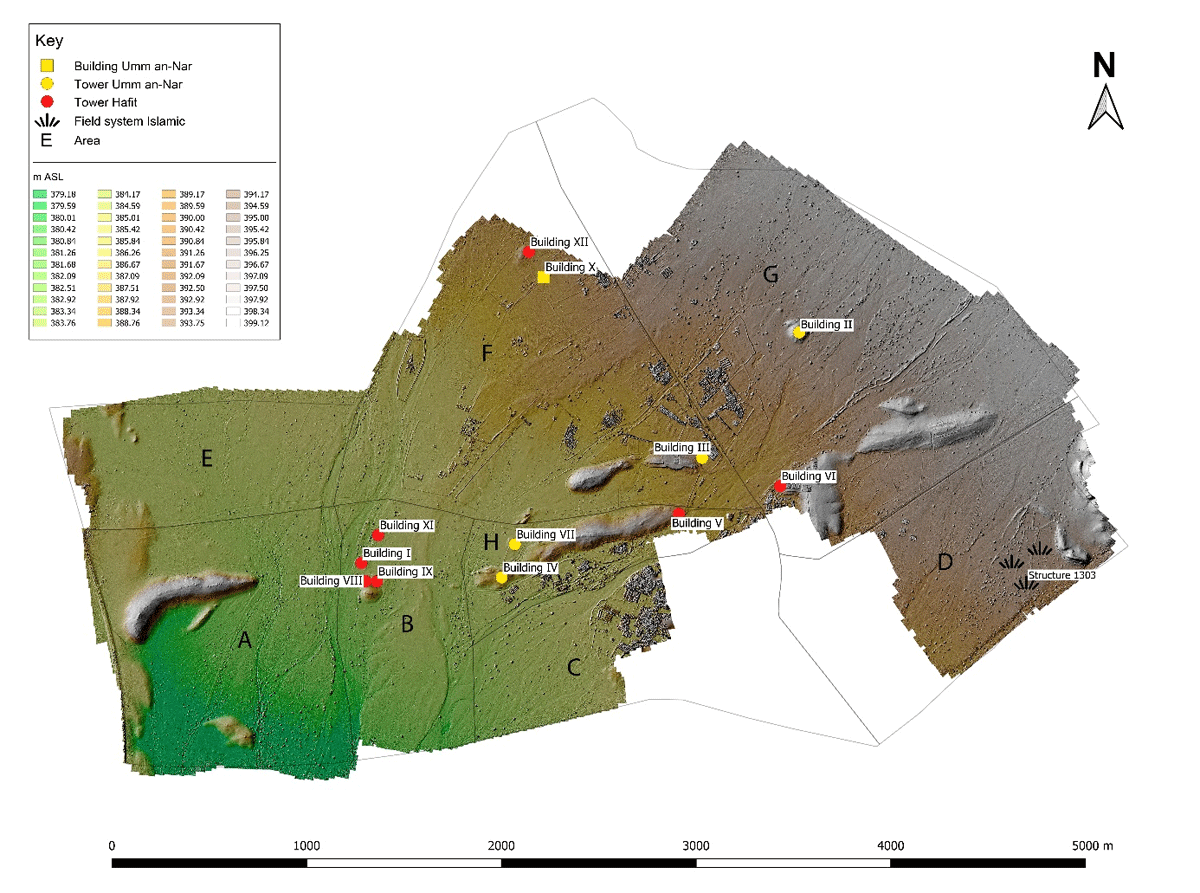
Figure 2
Digital Elevation Model (DEM) with location of main buildings in Al-Khashbah.
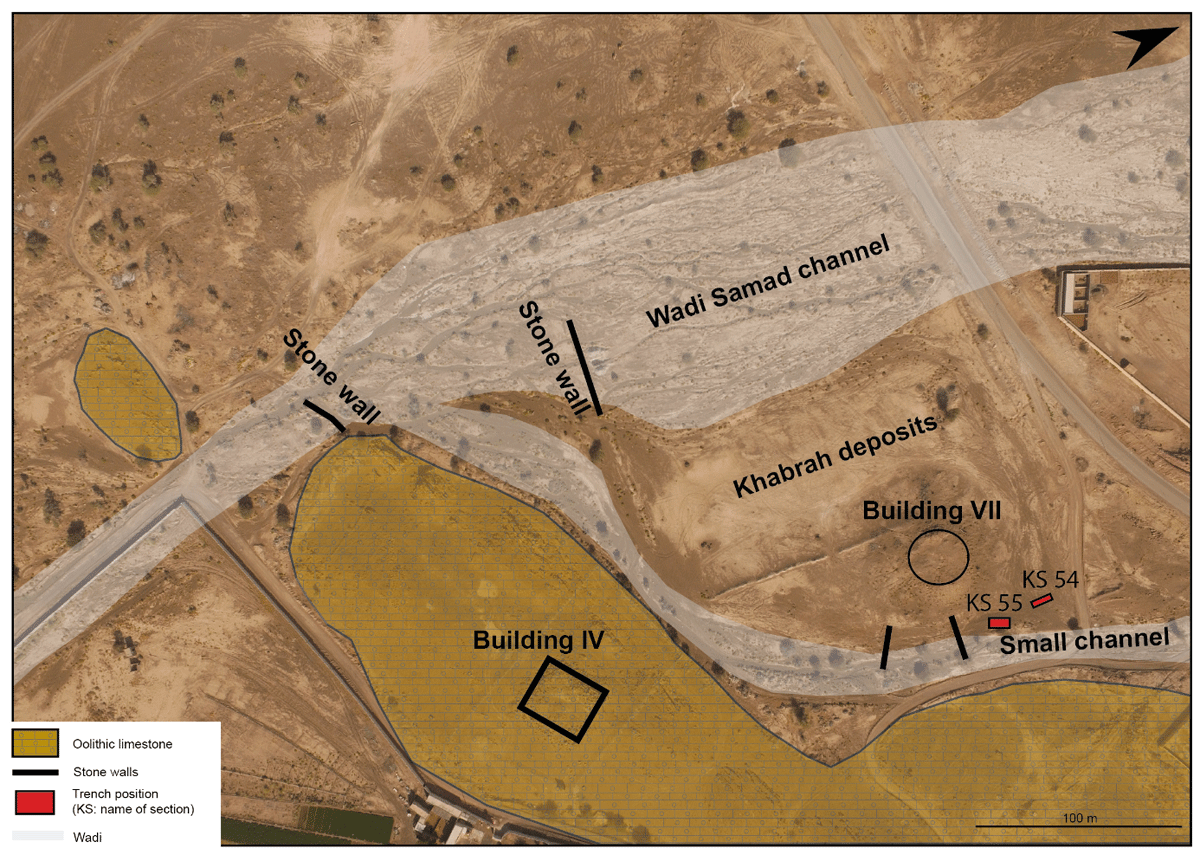
Figure 3
Top view of study area with location of KS54 and KS55, stone walls and channels.

Figure 4
Position of sections KS55 and KS54 compared to Building VII (for stratigraphic units see Figure 13).
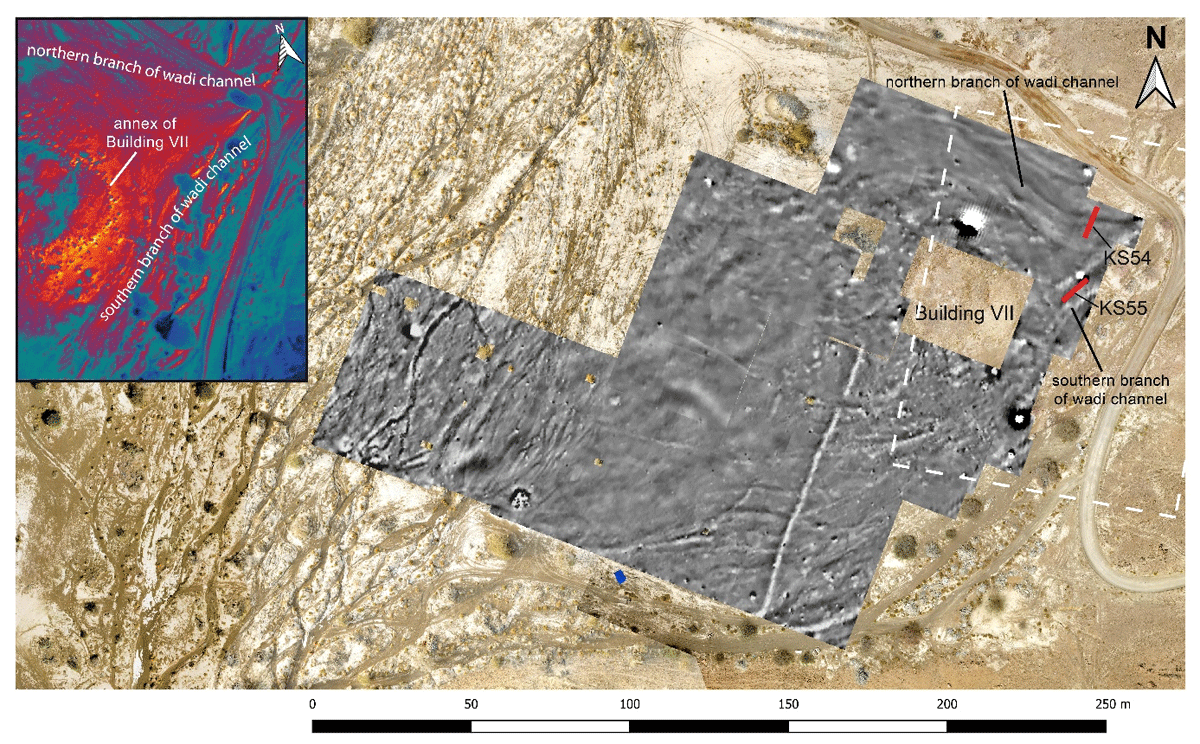
Figure 5
Magnetometer prospection around Building VII with location of KS55 (southern part executed by J. Herrmann [Schmidt et al. 2021: 33, Fig. 34], northern part by C. Schmidt, UmWeltWandel project). Inset: thermal imagery of the area northeast of Building VII, where KS55 and KS54 are located (dashed line).
Table 1
Sediment and soil laboratory data of KS55.
| PROFILE-LAYER | SAMPLE NUMBER | DEPTH [CM] | EC [μS/CM] | PHH2O | CACO3 [%] | NT [%] | CT [%] | ST [%] | CORG [%] | 0.01–2 µM | 2–50 µM | 50–200 µM | 200–500 µM | 500–2000 µM |
|---|---|---|---|---|---|---|---|---|---|---|---|---|---|---|
| KS55-18 | U1098-1 | 0–5 | 329 | 8.1 | 15.7 | <0.03 | 1.97 | 0.08 | 0.09 | 0.7 | 4.4 | 6.3 | 7.3 | 81.2 |
| KS55-17 | U1099-1 | 5–10 | 2320 | 8.1 | 22.9 | <0.03 | 2.98 | 0.08 | 0.24 | 5.1 | 38.0 | 48.3 | 4.3 | 4.4 |
| KS55-17 | U1100-1 | 10–15 | 4900 | 8.0 | 21.4 | <0.03 | 2.85 | 0.49 | 0.28 | 4.3 | 27.5 | 12.0 | 1.0 | 55.2 |
| KS55-17 | U1101-1 | 15–20 | 6180 | 8.0 | 21.6 | 0.05 | 2.94 | 0.64 | 0.35 | 7.7 | 64.1 | 23.3 | 3.8 | 1.1 |
| KS55-17 | U1102-1 | 20–25 | 6200 | 8.0 | 21.1 | <0.03 | 2.95 | 0.48 | 0.42 | 4.7 | 49.5 | 17.4 | 2.9 | 25.4 |
| KS55-12 | U1103-1 | 25–30 | 7240 | 8.0 | 22.2 | <0.03 | 2.98 | 0.46 | 0.31 | 6.9 | 62.6 | 24.6 | 5.0 | 0.8 |
| KS55-11 | U1104-1 | 30–35 | 7940 | 8.0 | 21.5 | <0.03 | 2.98 | 0.45 | 0.41 | 7.9 | 65.4 | 20.6 | 4.5 | 1.6 |
| KS55-11 | U1105-1 | 35–40 | 8770 | 8.1 | 21.6 | 0.04 | 2.98 | 0.36 | 0.38 | 7.0 | 59.6 | 26.2 | 5.7 | 1.5 |
| KS55-11 | U1106-1 | 40–45 | 9420 | 8.1 | 21.5 | <0.03 | 2.95 | 0.44 | 0.37 | 7.6 | 66.5 | 24.2 | 1.6 | 0.1 |
| KS55-11 | U1107-1 | 45–50 | 10750 | 8.1 | 22.0 | <0.03 | 3.02 | 0.37 | 0.38 | 6.7 | 63.0 | 26.3 | 3.6 | 0.4 |
| KS55-8 | U1108-1 | 50–55 | 12030 | 8.1 | 23.0 | 0.03 | 3.02 | 0.43 | 0.25 | 5.6 | 52.4 | 31.5 | 8.1 | 2.4 |
| KS55-8 | U1109-1 | 55–60 | 11290 | 8.0 | 22.6 | 0.04 | 2.99 | 0.47 | 0.28 | 7.2 | 59.2 | 26.7 | 5.8 | 1.1 |
| KS55-8 | U1110-1 | 60–65 | 11730 | 8.0 | 22.5 | 0.04 | 3.08 | 0.45 | 0.38 | 9.3 | 68.2 | 21.0 | 1.5 | 0.0 |
| KS55-6 | U1111-1 | 65–70 | 13310 | 8.0 | 21.4 | 0.03 | 3.50 | 0.33 | 0.92 | 6.5 | 71.4 | 18.8 | 3.0 | 0.3 |
| KS55-6 | U1112-1 | 70–75 | 15400 | 7.9 | 22.0 | <0.03 | 3.13 | 0.43 | 0.50 | 9.4 | 72.4 | 16.0 | 1.7 | 0.6 |
| KS55-6 | U1113-1 | 75–80 | 15750 | 7.9 | 23.9 | <0.03 | 3.08 | 0.36 | 0.21 | 8.6 | 60.0 | 19.0 | 7.0 | 5.4 |
| KS55-6 | U1114-1 | 80–85 | 17170 | 7.8 | 23.6 | <0.03 | 3.14 | 0.14 | 0.31 | 8.4 | 71.4 | 14.9 | 0.4 | 4.9 |
| KS55-6 | U1115-1 | 85–90 | 19260 | 7.8 | 23.2 | <0.03 | 3.05 | 0.11 | 0.27 | 9.7 | 80.5 | 9.8 | 0.0 | 0.0 |
| KS55-6 | U1116-1 | 90–95 | 18680 | 7.9 | 23.3 | 0.03 | 3.11 | 0.11 | 0.31 | 9.3 | 69.9 | 16.8 | 0.7 | 3.2 |
| KS55-5 | U1117-1 | 95–100 | 19630 | 7.9 | 22.3 | <0.03 | 3.11 | 0.11 | 0.43 | 9.1 | 67.5 | 19.1 | 0.5 | 3.8 |
| KS55-5 | U1118-1 | 100–105 | 16720 | 8.0 | 23.2 | <0.03 | 3.13 | 0.09 | 0.34 | 7.6 | 56.6 | 22.1 | 3.5 | 10.2 |
| KS55-5 | U1119-1 | 105–110 | 15950 | 8.0 | 22.6 | <0.03 | 3.12 | 0.10 | 0.41 | 8.7 | 65.6 | 23.8 | 1.0 | 0.8 |
| KS55-5 | U1120-1 | 110–115 | 21200 | 7.9 | 22.8 | 0.04 | 3.12 | 0.10 | 0.38 | 7.9 | 59.6 | 25.8 | 4.5 | 2.3 |
| KS55-5 | U1121-1 | 115–120 | 19720 | 7.9 | 22.6 | 0.05 | 3.14 | 0.12 | 0.44 | 6.4 | 55.2 | 31.0 | 4.6 | 2.8 |
| KS55-5 | U1122-1 | 120–125 | 14560 | 8.0 | 23.3 | <0.03 | 3.12 | 0.09 | 0.33 | 7.6 | 60.4 | 23.0 | 3.7 | 5.3 |
| KS55-5 | U1123-1 | 125–130 | 14860 | 8.1 | 23.4 | <0.03 | 3.16 | 0.10 | 0.36 | 6.8 | 60.7 | 27.4 | 4.5 | 0.6 |
| KS55-5 | U1124-1 | 130–135 | 14450 | 8.0 | 23.0 | <0.03 | 3.13 | 0.11 | 0.37 | 8.0 | 60.3 | 22.9 | 4.7 | 4.0 |
| KS55-4 | U1125-1 | 135–140 | 14180 | 8.1 | 23.6 | <0.03 | 3.15 | 0.10 | 0.32 | 6.9 | 55.8 | 31.2 | 5.1 | 1.0 |
| KS55-4 | U1126-1 | 140–145 | 10620 | 8.2 | 22.4 | <0.03 | 3.24 | 0.09 | 0.55 | 8.4 | 64.7 | 23.8 | 2.5 | 0.6 |
| KS55-4 | U1127-1 | 145–150 | 10870 | 7.9 | 24.3 | <0.03 | 3.23 | 0.09 | 0.32 | 7.4 | 58.2 | 24.2 | 3.7 | 6.5 |
| KS55-4 | U1128-1 | 150–155 | 7850 | 8.2 | 28.4 | <0.03 | 3.84 | 0.09 | 0.43 | 6.6 | 62.0 | 19.4 | 6.1 | 5.7 |
| KS55-3 | U1129-1 | 155–160 | 7910 | 8.2 | 26.1 | <0.03 | 3.50 | 0.08 | 0.37 | 5.9 | 55.6 | 29.9 | 7.2 | 1.4 |
| KS55-3 | U1130-1 | 160–165 | 7160 | 8.2 | 23.5 | <0.03 | 3.32 | 0.08 | 0.49 | 9.9 | 64.7 | 22.9 | 2.1 | 0.4 |
| KS55-2 | U1131-1 | 165–170 | 6690 | 8.3 | 23.0 | <0.03 | 3.24 | 0.08 | 0.49 | 9.4 | 63.0 | 21.7 | 2.3 | 3.5 |
| KS55-1 | U1132-1 | 170–175 | 6040 | 8.3 | 22.7 | 0.03 | 3.25 | 0.07 | 0.52 | 7.3 | 68.2 | 22.7 | 1.4 | 0.5 |
| KS55-1 | U1133-1 | 175–180 | 6900 | 8.2 | 23.5 | <0.03 | 3.27 | 0.08 | 0.45 | 7.7 | 64.7 | 26.1 | 1.3 | 0.1 |
| KS55-1 | U1134-1 | 180–185 | 4720 | 8.4 | 23.4 | <0.03 | 3.28 | 0.08 | 0.47 | 6.5 | 46.9 | 31.1 | 7.4 | 8.0 |
| KS55-1 | U1135-1 | 185–190 | 4760 | 8.4 | 23.9 | <0.03 | 3.33 | 0.07 | 0.45 | 7.0 | 62.6 | 26.6 | 3.2 | 0.5 |
| KS55-1 | U1136-1 | 190–195 | 4500 | 8.3 | 22.7 | <0.03 | 3.25 | 0.07 | 0.53 | 6.4 | 58.4 | 30.8 | 4.2 | 0.2 |
| KS55-1 | U1137-1 | 195–200 | 9430 | 8.1 | 22.6 | <0.03 | 3.20 | 0.09 | 0.49 | 6.7 | 62.6 | 26.5 | 3.5 | 0.6 |
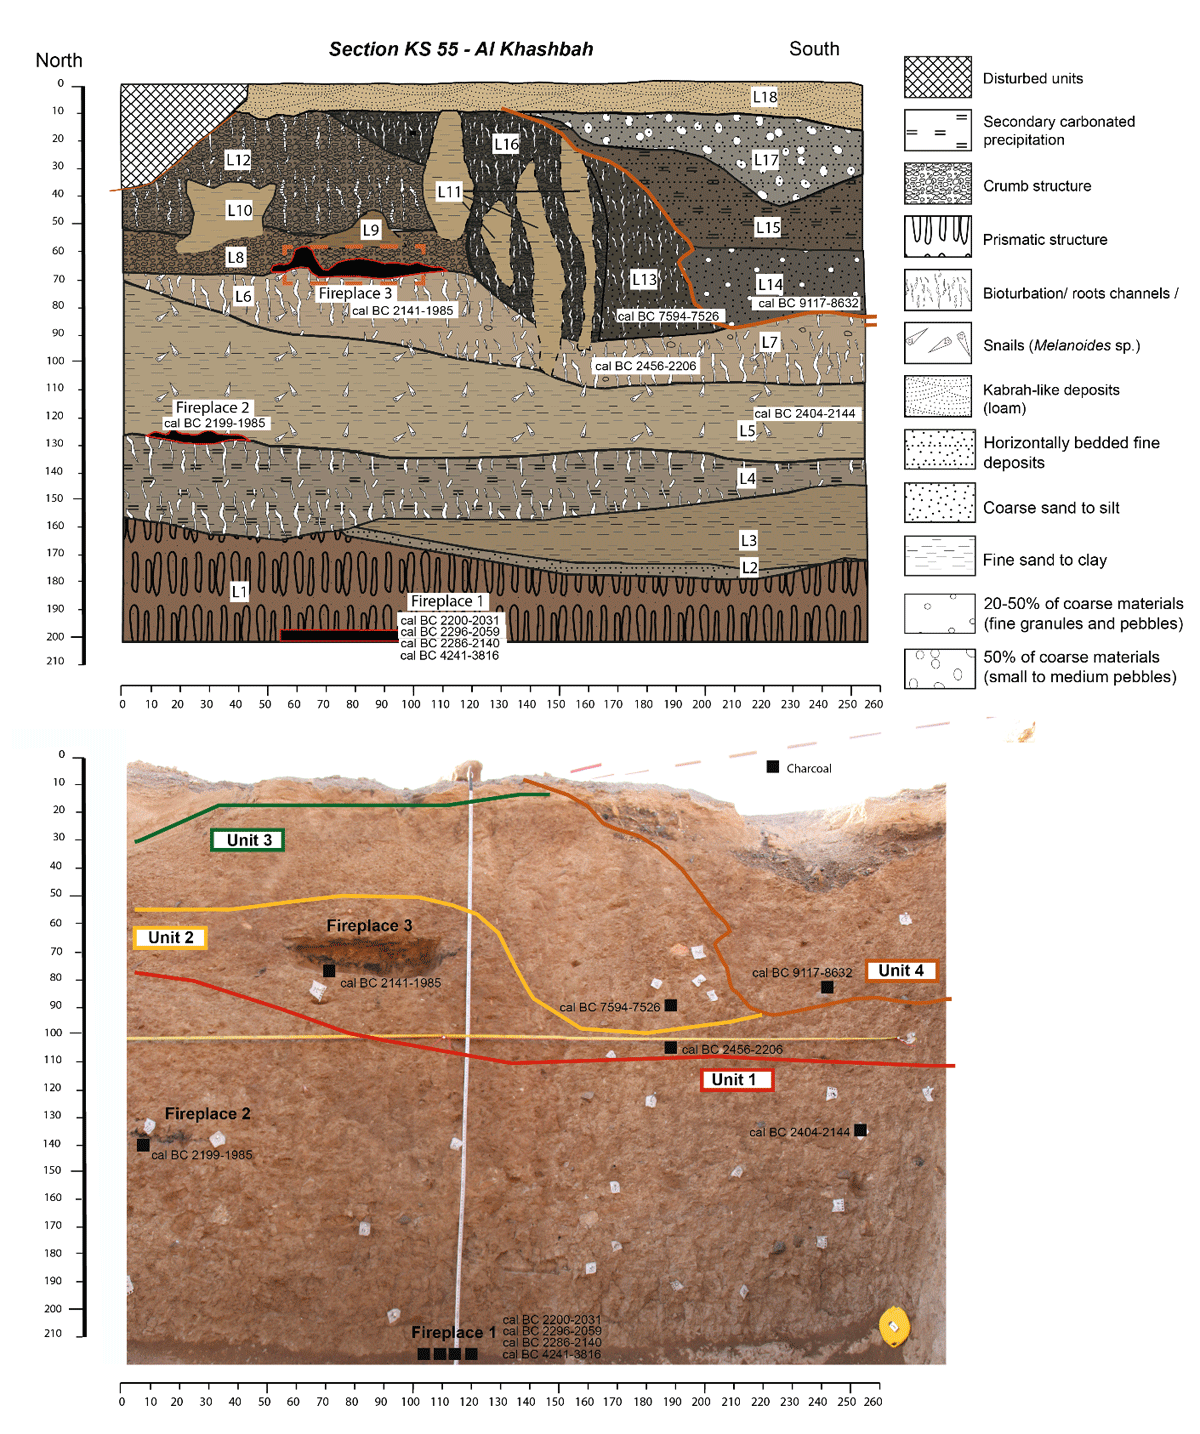
Figure 6
The KS55 section profile presented as a) a descriptive diagram of major layers (sedimentary facies) with associated radiocarbon (charcoal) dates in cal BC; b) an orthoimage of KS55 with the major stratigraphic units highlighted. Scales are presented in cm below surface and cm from left section margin.
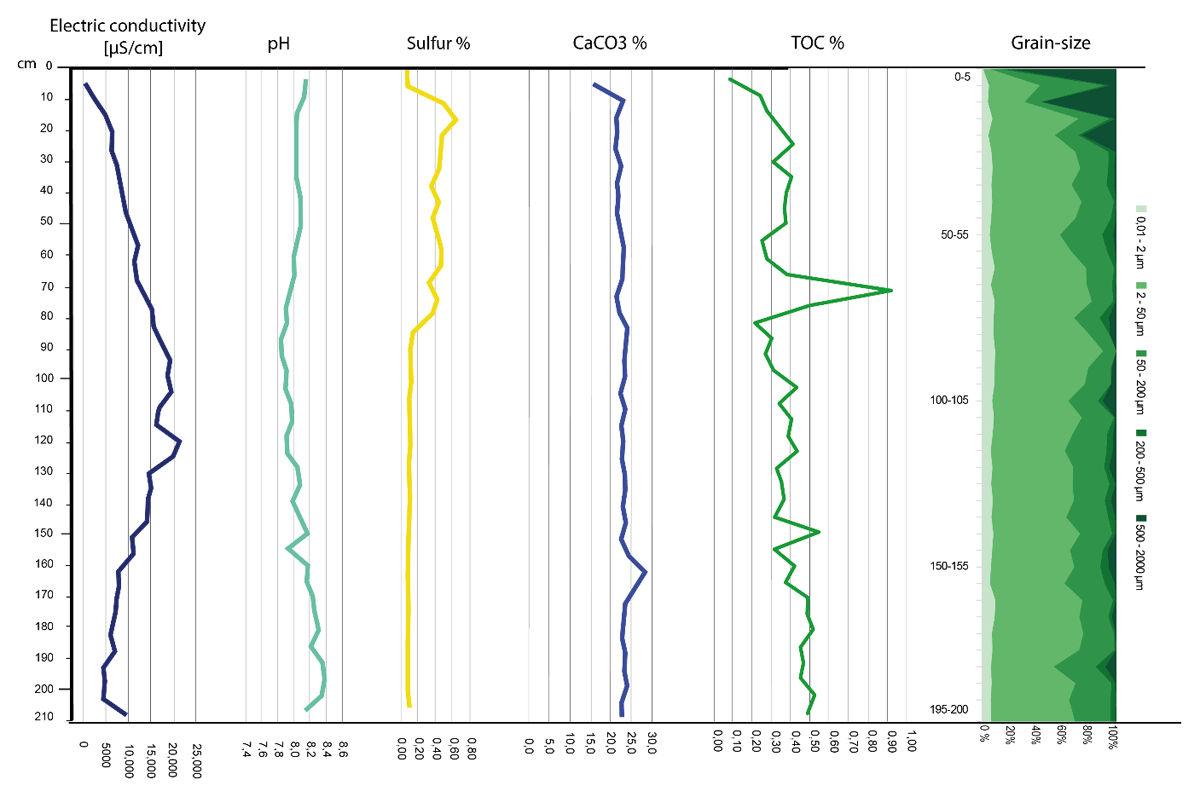
Figure 7
Results of the sedimentological and chemical analyses from KS55; from left to right: electric conductivity, pH, sulfur content (in %), CaCO3 content (in %), Total organic carbon (in %) and grain-size (for laboratory data see Table 1).
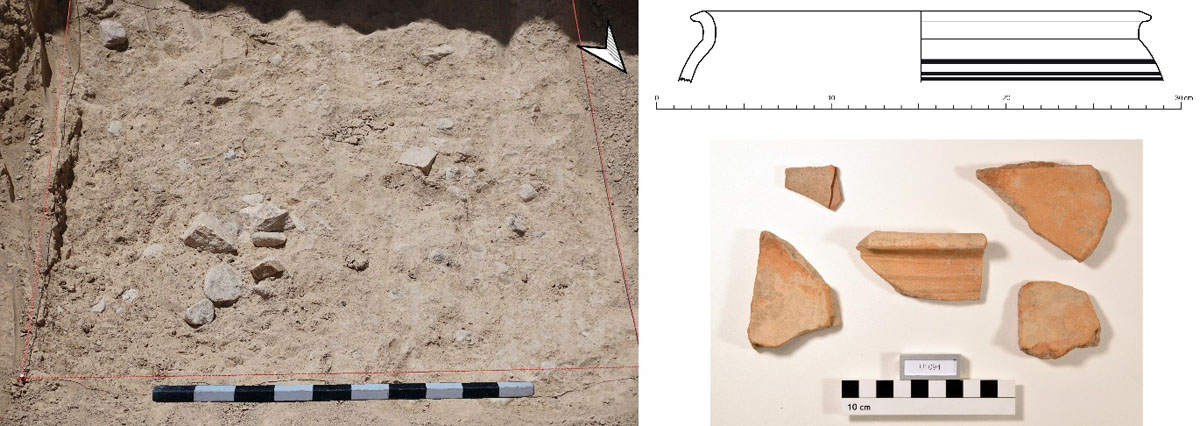
Figure 8
Fireplace at the bottom of KS55 (left) and associated Umm an-Nar pottery (right).
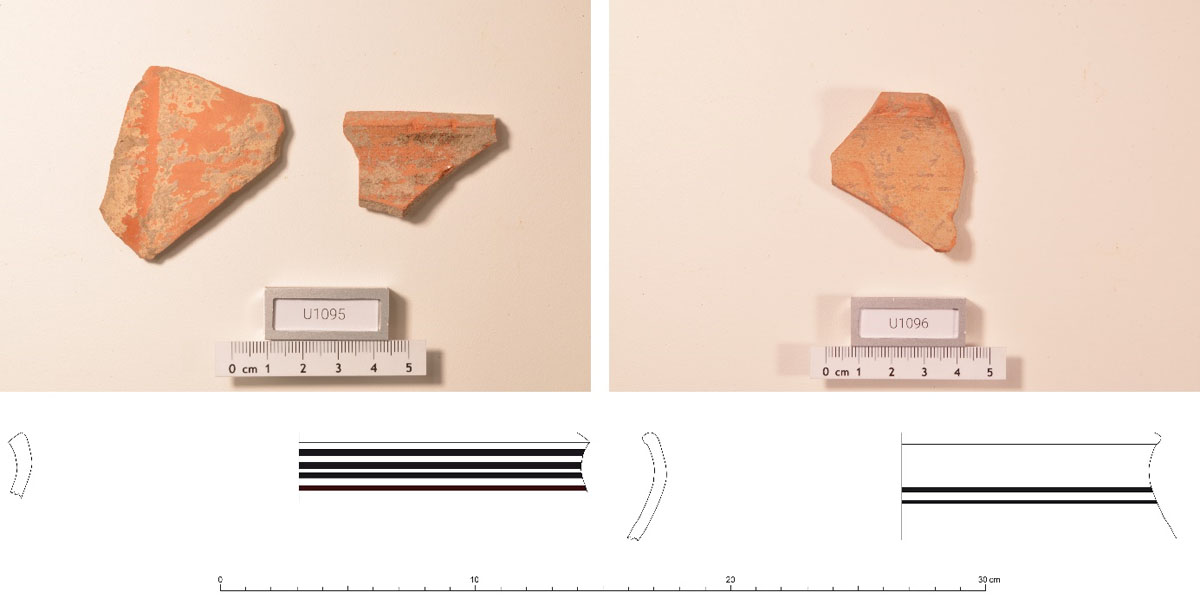
Figure 9
Umm an-Nar pottery from layers 12 (left) and 15 (right).
Table 2
Calibrated 14C dates for KS55 in Al-Khashbah (lab: Curt-Engelhorn-Zentrum Archäometrie, Mannheim, Germany; software OxCal v4.4.2; Bronk Ramsey (2017); r:5; Atmospheric data from Reimer et al. (2020). The shell data is not corrected for a possible hardwater effect.
| SAMPLE NUMBER | LAB NUMBER | MATERIAL | SITE AND LAYER | 14C AGE [YR BP] | ± | CALIBRATED 14C AGE (2 σ) |
|---|---|---|---|---|---|---|
| U1044-2 | MAMS 61286 | Melanoides tuberculata | KS55-15 | 4685 | 20 | 3522–3373 cal BC |
| U1071-1 | MAMS 57935 | charcoal | KS55-14 | 9476 | 37 | 9117–8632 cal BC |
| U1049-2 | MAMS 61289 | Melanoides tuberculata | KS55-14 | 4902 | 20 | 3710–3639 cal BC |
| U1092-1 | MAMS 57934 | charcoal | KS55-13 | 8517 | 36 | 7594–7526 cal BC |
| U1058-2 | MAMS 61291 | Melanoides tuberculata | KS55-13 | 4745 | 20 | 3632–3382 cal BC |
| U1483-2 | MAMS 61309 | Melanoides tuberculata | KS55-12 | 4792 | 18 | 3638–3528 cal BC |
| U1082-1 | MAMS 57932 | charcoal | KS55-7 | 3853 | 27 | 2456–2206 cal BC |
| U1048-2 | MAMS 61288 | Melanoides tuberculata | KS55-6 | 4734 | 20 | 3629–3379 cal BC |
| U1466-2 | MAMS 61304 | Zootecus insularis | KS55-6 | 4806 | 19 | 3641–3528 cal BC |
| U1466-1 | MAMS 67176 | charcoal | KS55-6 | 3692 | 18 | 2141–1985 cal BC |
| U1087-1 | MAMS 57930 | charcoal | KS55-5 | 3706 | 27 | 2199–1985 cal BC |
| U1080-1 | MAMS 57929 | charcoal | KS55-5 | 3820 | 27 | 2404–2144 cal BC |
| U1064-2 | MAMS 61292 | Melanoides tuberculata | KS55-5 | 4503 | 20 | 3345–3100 cal BC |
| U1083-1 | MAMS 57928 | charcoal | KS55-4 | 3822 | 32 | 2452–2144 cal BC |
| U1482-2 | MAMS 61308 | Zootecus insularis | KS55-4 | 5540 | 19 | 4445–4343 cal BC |
| U1047-2 | MAMS 61287 | Zootecus insularis | KS55-4 | 6811 | 22 | 5735–5641 cal BC |
| U1067-2 | MAMS 61293 | Melanoides tuberculata | KS55-3 | 4139 | 20 | 2871–2625 cal BC |
| U1069-2 | MAMS 61294 | Zootecus insularis | KS55-3 | 5239 | 21 | 4221–3977 cal BC |
| U1081-1 | MAMS 56409 | charcoal | KS55-1 | 3716 | 24 | 2200–2031 cal BC |
| U1462-3 | MAMS 67175 | charcoal | KS55-1 | 3780 | 18 | 2286–2140 cal BC |
| U1463-2 | MAMS 57936 | charcoal | KS55-1 | 3782 | 28 | 2296–2059 cal BC |
| U1078-1 | MAMS 56408 | charcoal | KS55-1 | 5217 | 63 | 4241–3816 cal BC |
| U1461-2 | MAMS 61302 | Melanoides tuberculata | KS55-1 | 4646 | 19 | 3512–3365 cal BC |

Figure 10
Qualitative pollen and NPP results from soil sequence KS55. Each dot indicates the presence of the pollen taxon at the respective depth.

Figure 11
Quantitative micro- and macro-charcoal results from soil sequence KS55.

Figure 12
Stable oxygen isotope data from eight M. tuberculata snails (U1044; U1048; U1049; U1058; U1461-M; U1064; U1067; U1483-FS8) recovered from section KS55. Each specimen’s location in the section is marked at the top left.
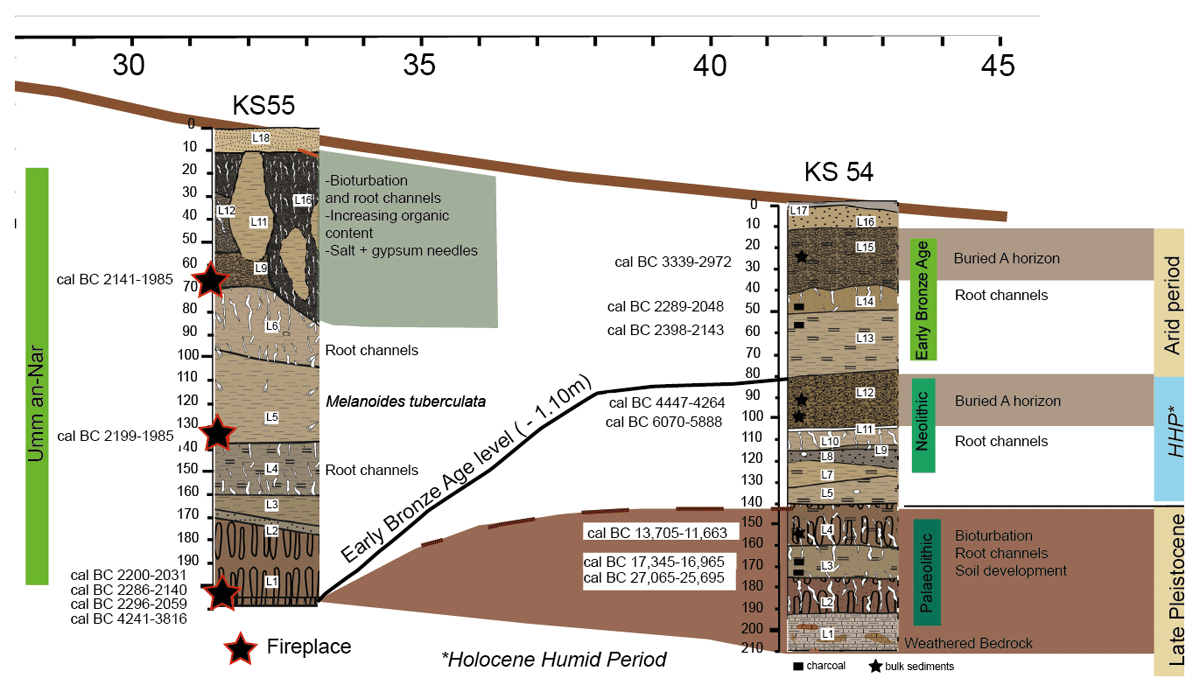
Figure 13
Interpretation of the KS55 sequence in comparison to KS54. Stratigraphic connection between the two Bronze Age levels.
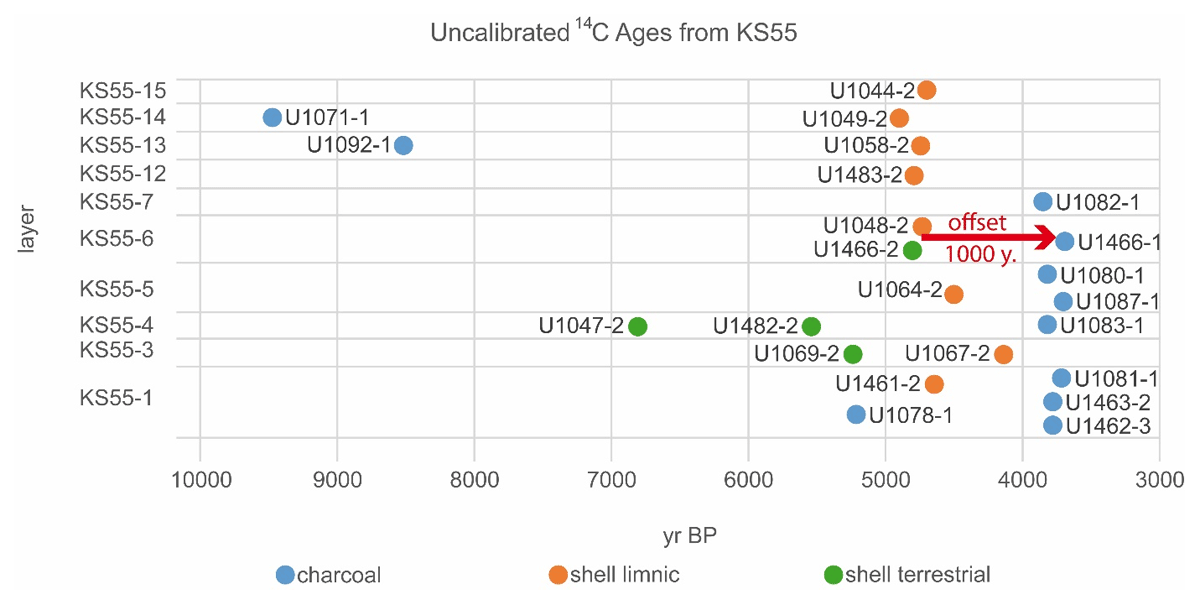
Figure 14
Comparison of uncalibrated radiocarbon measurements of shell and charcoal from KS55, pointing to a systematic offset between shells and charcoal, likely caused by the hardwater effect.