
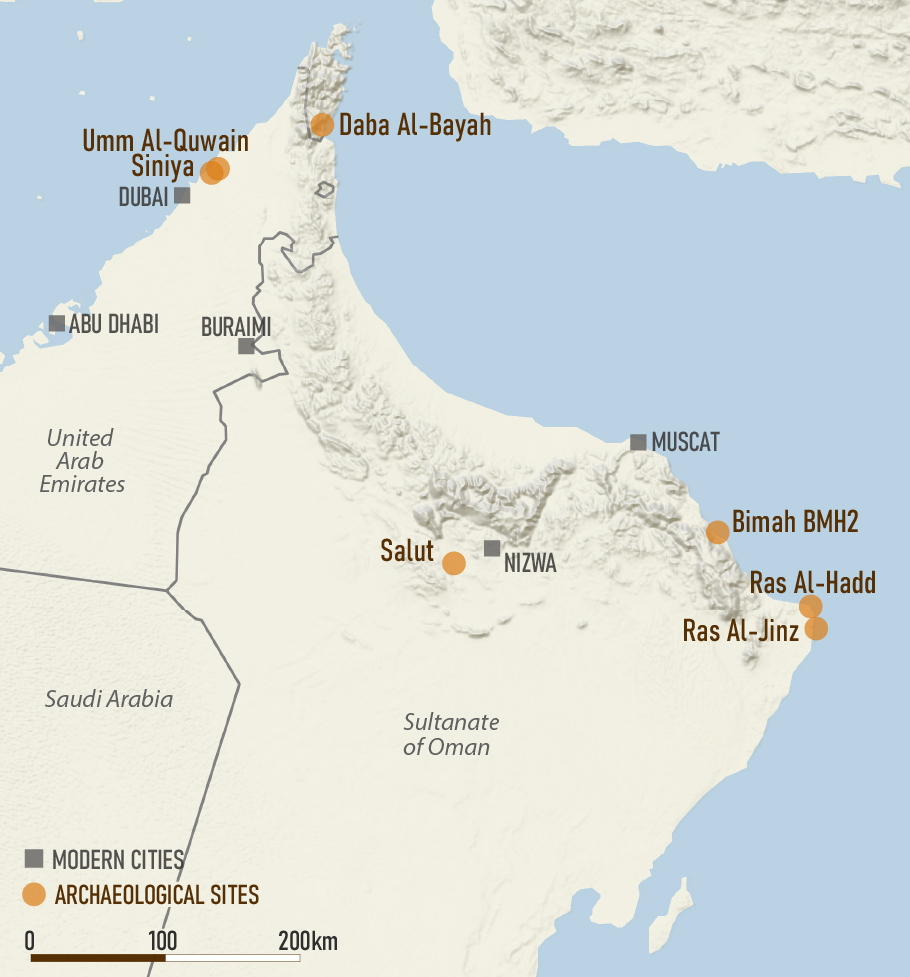
Figure 1
Map of the sites cited in the study.
Table 1
List of the sites considered.
| SITE | COUNTRY – REGION | PERIOD | CHRONOLOGY | BIBLIOGRAPHY |
|---|---|---|---|---|
| Salut Tower 1 (ST1) | Oman – Al-Dakhiliyah | Early Bronze Age | 2400–2000 BC (Umm an-Nar) | Degli Esposti 2016 |
| Daba Al-Bayah – LCG2 | Oman – Musandam | Iron Age 2 – PIR | 1000 BC-400 AD | Genchi et al. 2022 |
| Salut Fortified area (Husn) & Settlement (Qaryat) | Oman – Al-Dakhiliyah | Early Iron Age | 1300–600 BC | Avanzini, Degli Esposti 2018; Degli Esposti 2021 |
| Bimah – BMH2 | Oman – Ash-Sharqiyyah North | Early Iron Age | 900–600 BC | Loreto 2018 |
| Tell Abraq | UAE – Umm Al-Quwain | Early Iron Age (Iron Age 2) | 1300–300 BC | Degli Esposti et al. 2023 |
| Siniya LAS | UAE – Umm Al-Quwain | Late Antique | 5th–6th century AD | Power et al. 2023; 2024 |
| Siniya Old Town | UAE – Umm Al-Quwain | Late Modern Era | 18th century AD | Power et al. 2023; 2024 |
Table 2
Post-cranial bone measurements used in the LSI analysis after von den Driesch (1976).
| Dimension | Measures | Elements |
|---|---|---|
| Length | GL | radius, metacarpus, metatarsus, tibia, calcaneum |
| GLl; Glm | astragalus | |
| Width | Bp | humerus, radius, metacarpus, femur, tibia, metatarsus |
| BFp | radius | |
| Bd | humerus, radius, metacarpus, femur, tibia, metatarsus, astragalus | |
| BFd | radius | |
| BT | humerus | |
| Depth | Dd | tibia |
| DD | metacarpus | |
| Dp | humerus, radius, metacarpus, metatarsus | |
| Dl | astragalus |
Table 3
Results of the Kruskal-Wallis test for the LSI width, length and depth values among sites. In taxa S = sheep; G = goat; ns = not significant.
| TAXA | VARIABLE | n.obs | CHI-SQUARED | Df | p-value | η2 | f | MAGNITUDE |
|---|---|---|---|---|---|---|---|---|
| S + G | Width | 267 | 18,592 | 2 | <0.005 | 0,048 | 0,230 | small |
| S + G | Length | 130 | 12,318 | 2 | <0.005 | 0,0411 | 0,211 | small |
| S + G | Depth | 119 | 4,164 | 2 | 0,007 | 0,2241 | 0,153 | small |
| G | Width | 196 | 12,090 | 2 | <0.005 | 0,0448 | 0,222 | small |
| G | Length | 98 | 16,411 | 2 | <0.005 | 0,0641 | 0,270 | moderate |
| G | Depth | 93 | 2,974 | 2 | ns | |||
| S | Width | 71 | 10,895 | 2 | <0.005 | 0,114 | 0,381 | moderate |
| S | Length | 32 | 0,025 | 1 | ns | |||
| S | Depth | 26 | 3,490 | 2 | ns | |||
Table 4
Statistically significant results of Dunn’s test for pairwise comparisons of width, length and depth variable among sites. P-values have been adjusted using the Bonferroni correction.
| TAXA | VARIABLE | SITE COMPARISON | z | p-value |
|---|---|---|---|---|
| S + G | Width | Daba~Salut Iron | –2,914 | 0,0107 |
| Width | Salut Bronze~Salut Iron | –3,2812 | 0,0031 | |
| Length | Daba~Salut Iron | –3,5958 | 0,001 | |
| Depth | Salut Bronze~Salut Iron | –2,4034 | 0,0487 | |
| G | Width | Daba~Salut Iron | –3,353 | 0,0024 |
| Length | Daba~Salut Iron | –3,4488 | 0,0017 | |
| Length | Salut Bronze~Salut Iron | –2,7177 | 0,0197 | |
| S | Width | Daba~Salut Bronze | 3,2274 | 0,0037 |
| Width | Salut Bronze~Salut Iron | –2,9764 | 0,0088 |
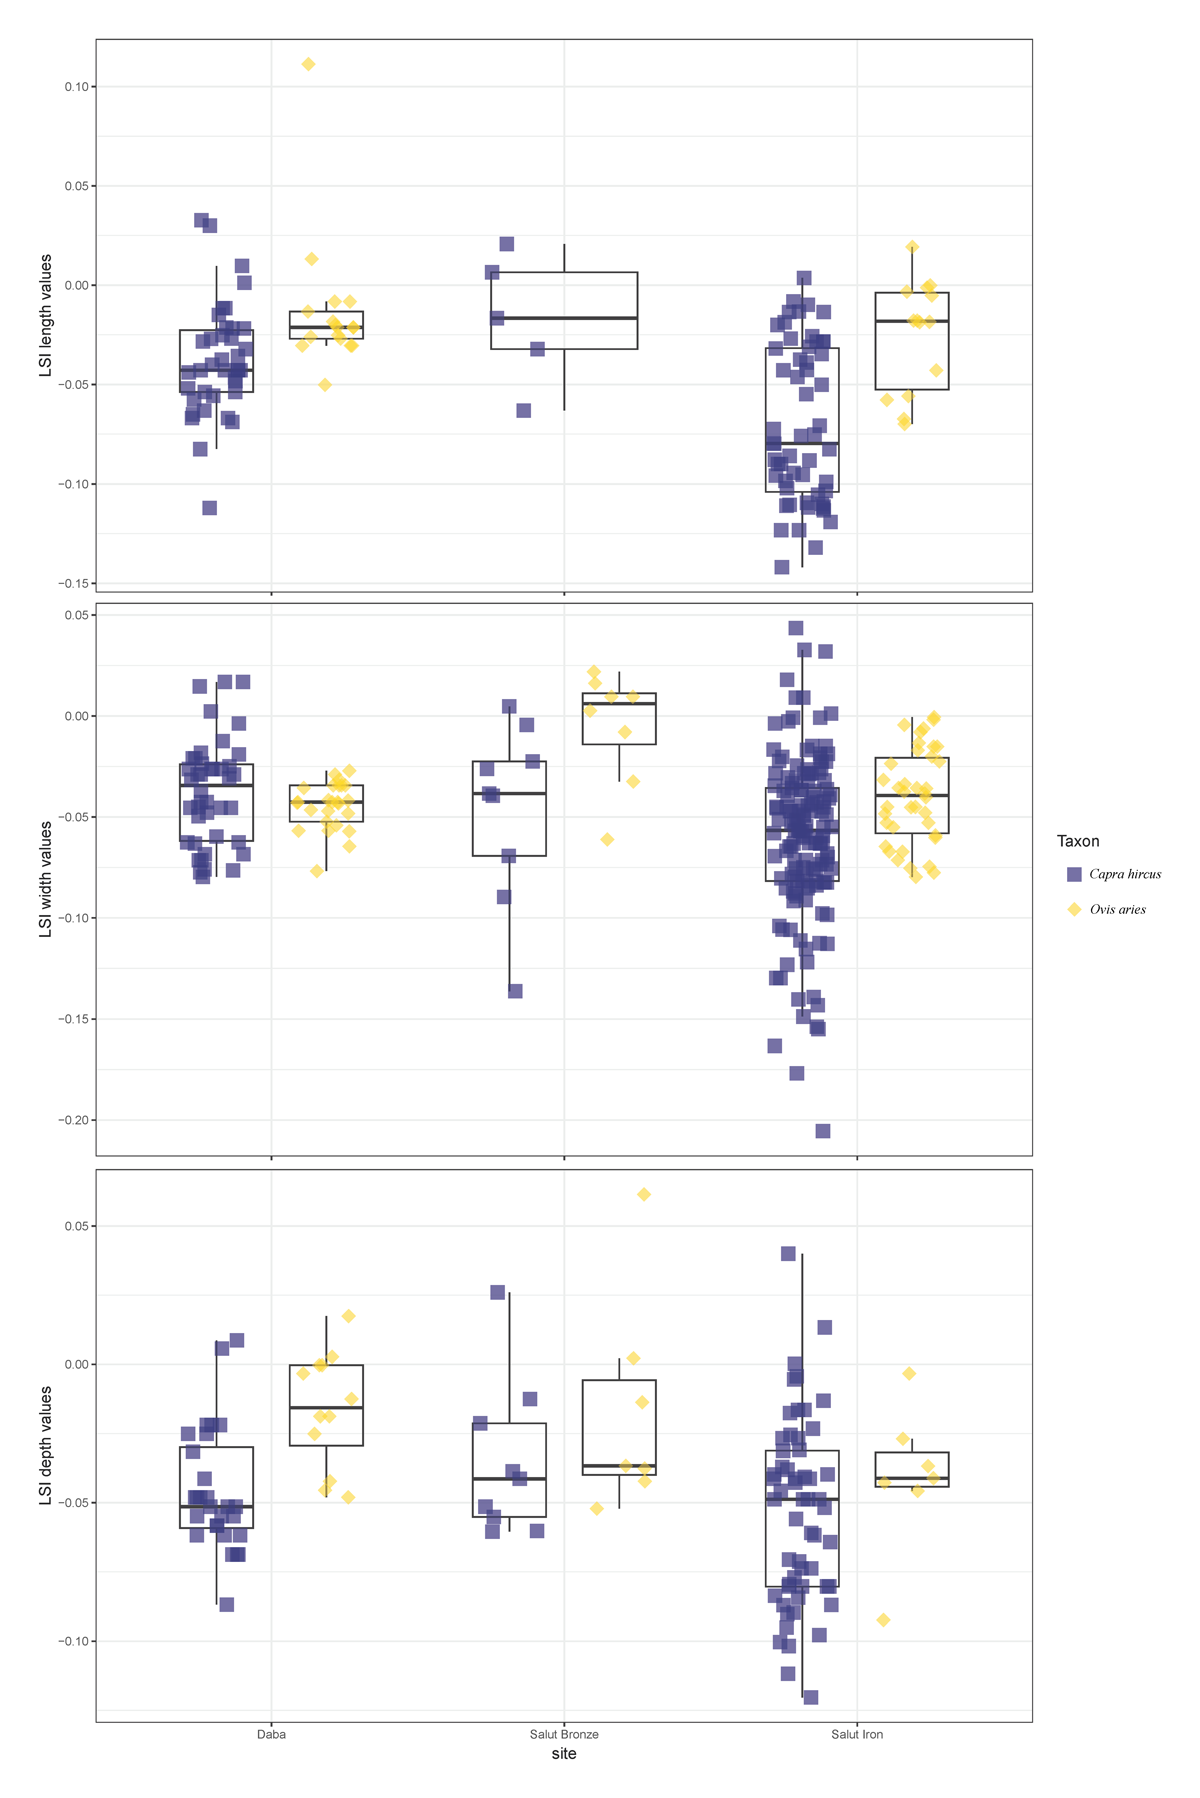
Figure 2
LSI boxplot of statistically significant results from the sites in Table 4 (Salut and Daba). The values for length (top), width (middle), and depth (bottom) are grouped by species, site and phase.
Table 5
Results of the Kruskal-Wallis test for the LSI width, length and depth values among taxa. P-values have been adjusted using the Bonferroni correction; ns = not significant.
| SITE | VARIABLE | CHI-SQUARED | df | p-value | η2 | f | MAGNITUDE |
|---|---|---|---|---|---|---|---|
| Salut Iron Age | Width | 9.0108 | 1 | 0.0027 | 0.0385 | 0.2041 | small |
| length | 13.637 | 1 | 0.0002 | 0.0608 | 0.2624 | medium | |
| Depth | 1.0574 | 1 | ns | ||||
| Salut Bronze Age | Width | 4.9042 | 1 | 0.0268 | 0.1952 | 0.5490 | large |
| Depth | 1.4818 | 1 | ns | ||||
| Daba | Width | 1.82 | 1 | ns | |||
| Length | 9.6544 | 1 | 0.0019 | 0.1154 | 0.3840 | medium | |
| Depth | 12.39 | 1 | 0.0004 | 0.151867 | 0.4595 | large | |
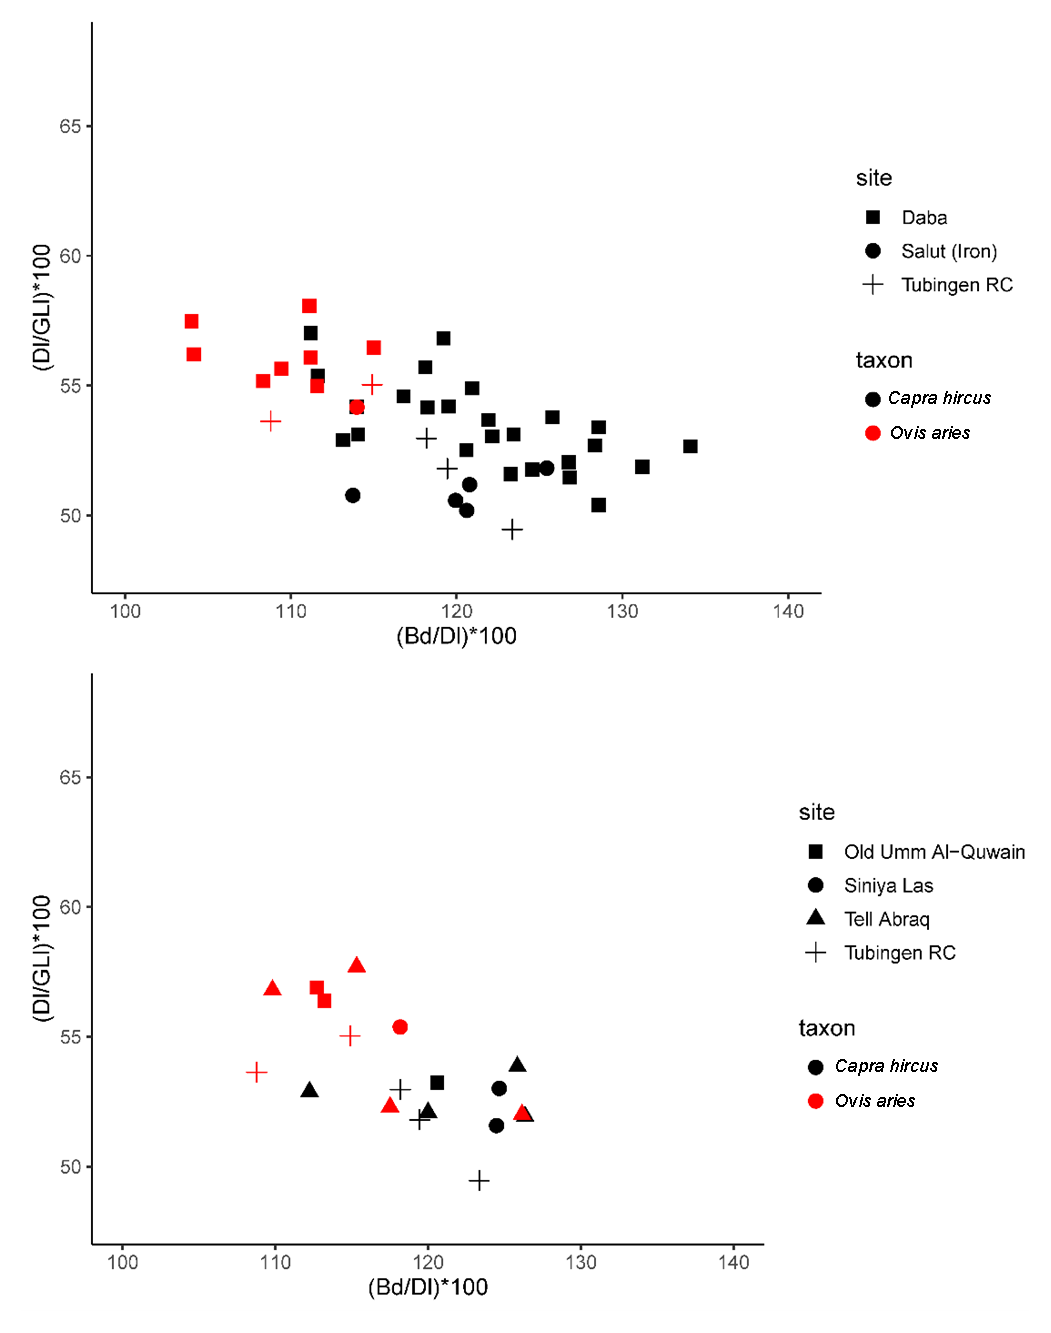
Figure 3
Astragali index scatterplot. Scatter diagrams of two indexes, Dl/GLl vs Bd/Dl calculated from Oman (top) and UAE (bottom) astragali. In the plot, symbols representing goats are black, while those representing sheep are red. The cross-shaped symbol (Tübingen RC) represents the modern reference.