
Table 1
Number of metacarpals (Mtc), metatarsals (Mtt), first phalanges (Ph1), second phalanges (Ph2) and third phalanges (Ph3) for every population included in the present study.
| CARIBOU’S NAME | SUBSPECIES | HABITAT | MOBILITY PATTERN | MTC | MTT | PH1 | PH2 | PH3 |
|---|---|---|---|---|---|---|---|---|
| Peary Caribou | Rangifer tarandus pearyi | Arctic Tundra (Open) | Migratory | 13 | 16 | 14 | 0 | 0 |
| Barren-Ground | Rangifer tarandus groenlandicus | Tundra (Open) | Migratory | 11 | 6 | 10 | 4 | 13 |
| Grant Caribou | Rangifer tarandus granti | Tundra (Open) | Migratory | 3 | 2 | 15 | 8 | 13 |
| Woodland Caribou | Rangifer tarandus caribou | Boreal Forest (Closed) | Sedentary | 6 | 7 | 21 | 14 | 17 |
| Eastern or Migratory Woodland Caribou | Rangifer tarandus caribou | Tundra (Open) | Migratory | 10 | 11 | 27 | 22 | 17 |
| Mountain Caribou | Rangifer tarandus caribou | Mountain (Closed) | Migratory | 5 | 8 | 28 | 15 | 11 |
| Mountain Caribou | Rangifer tarandus caribou | Mountain (Closed) | Sedentary | 6 | 8 | 17 | 17 | 7 |
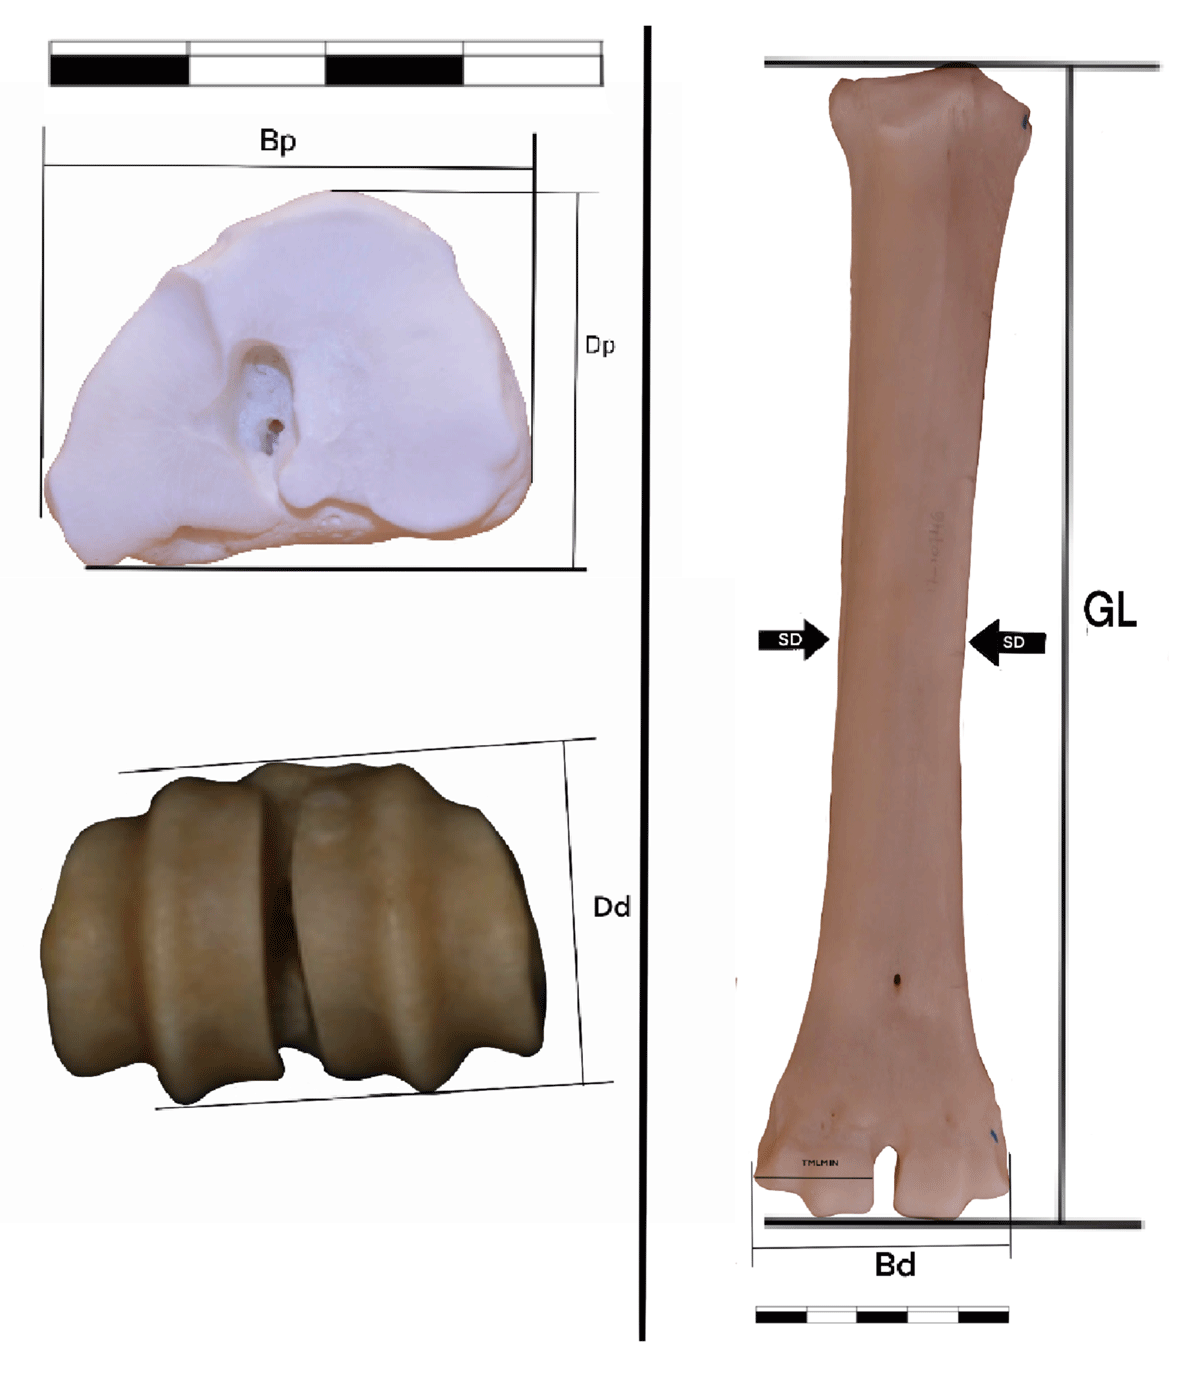
Figure 1
Measurements taken on metacarpals and described in the present work. See description Methods section of text.
GL: Greatest bone length (Von den Driesch, 1976).
Bp: Greatest breadth of the proximal end (Von den Driesch, 1976).
Dp: Greatest depth of the proximal end (Von den Driesch, 1976).
SD: Smallest breadth of the diaphysis (Von den Driesch, 1976).
Bd: Greatest breadth of the distal end (Von den Driesch, 1976).
Dd: Greatest depth of the distal end (Von den Driesch, 1976).
TMLMIN: Minimum mediolateral diameter of the medial trochlea (Klein et al. 2010).
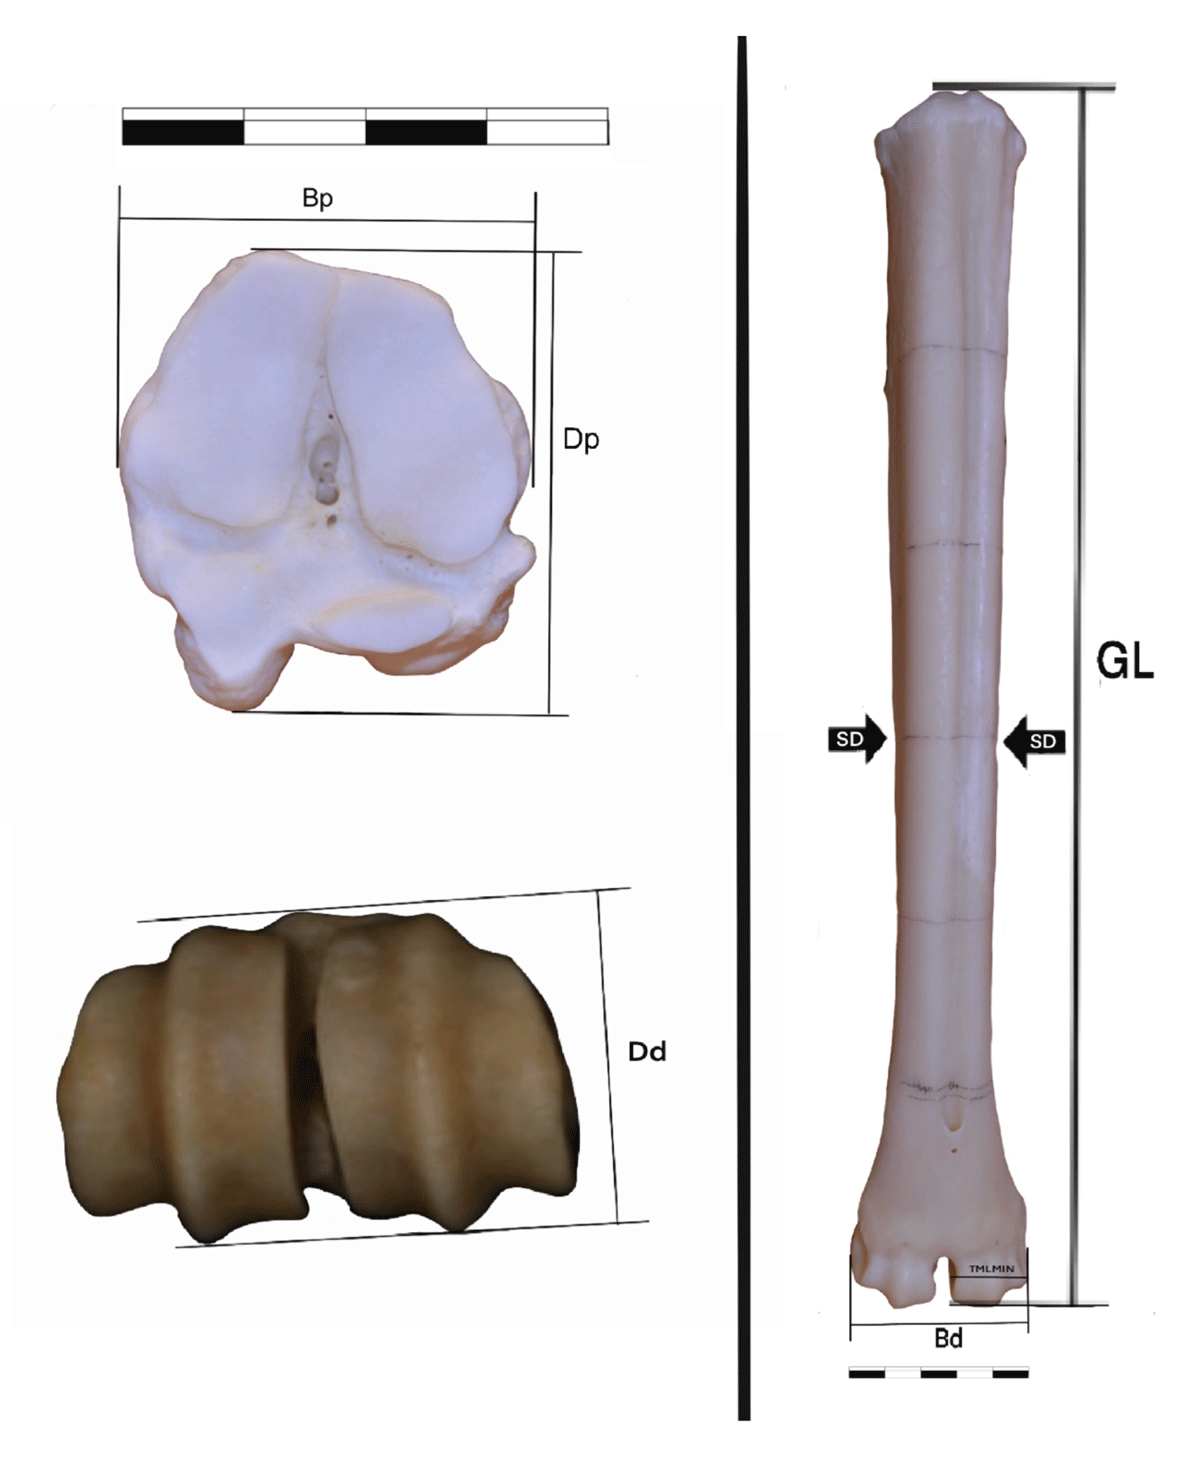
Figure 2
Measurements taken on metatarsals and described in the present work. See description Methods section of text.
GL: Greatest bone length (Von den Driesch, 1976).
Bp: Greatest breadth of the proximal end (Von den Driesch, 1976).
Dp: Greatest depth of the proximal end (Von den Driesch, 1976).
SD: Smallest breadth of the diaphysis (Von den Driesch, 1976).
Bd: Greatest breadth of the distal end (Von den Driesch, 1976).
Dd: Greatest depth of the distal end (Von den Driesch, 1976).
TMLMIN: Minimum mediolateral diameter of the medial trochlea (Klein et al. 2010).
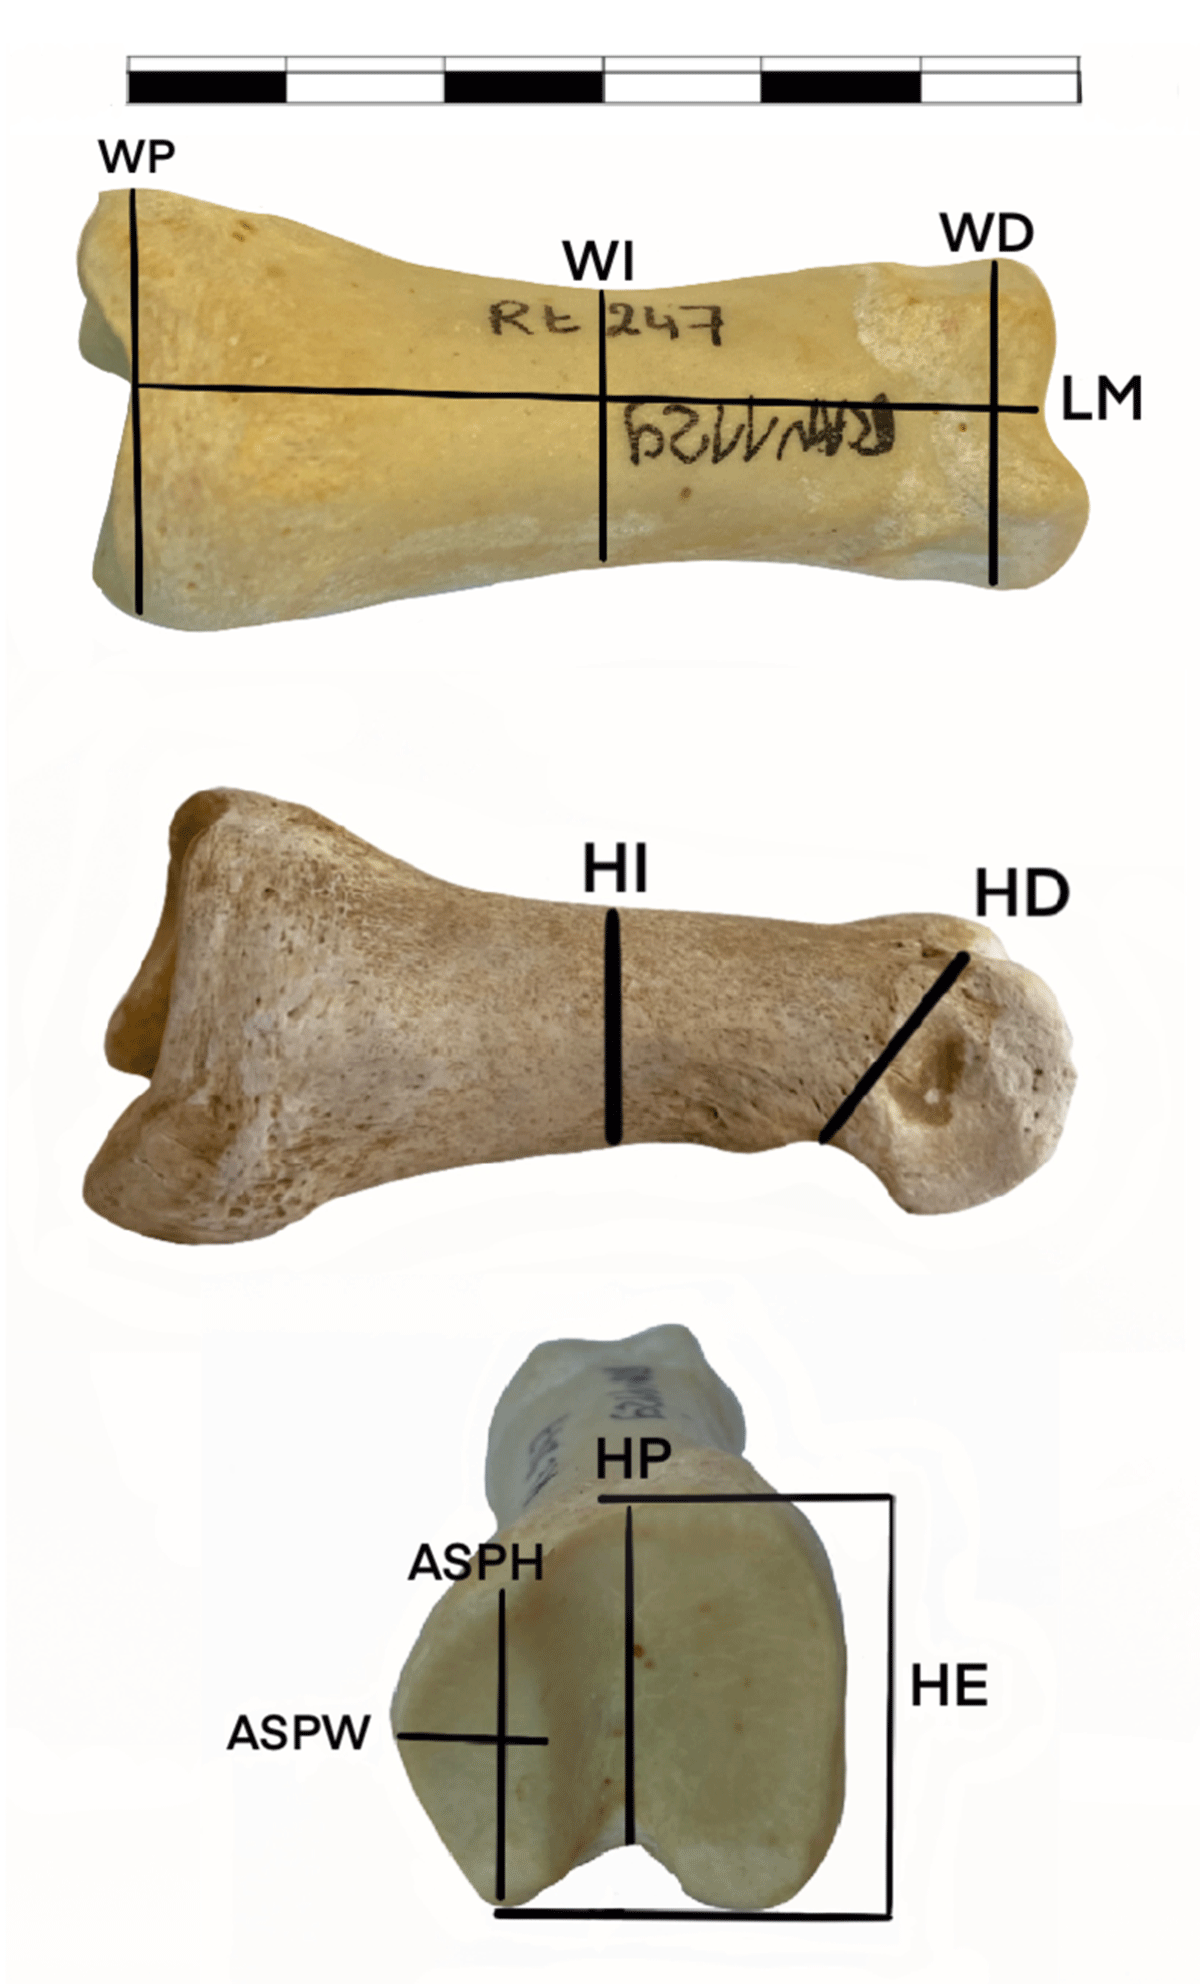
Figure 3
Measurements taken on first phalanges and described in the present work. See description Methods section of text.
GL: Greatest bone length (Von den Driesch, 1976).
Bp: Greatest breadth of the proximal end (Von den Driesch, 1976).
WI: Intermediate Width (DeGusta & Vrba, 2005).
Bd: Greatest breadth of the distal end (Von den Driesch, 1976).
LM: Midline Length. The minimum proximal distal dimension along the dorsal line (DeGusta & Vrba, 2005).
HI: Intermediate Height took on the ventral dimension of the shaft at midshaft (DeGusta & Vrba, 2005).
HD: Distal Height-the midline dorsal ventral dimension just proximal to the distal articular surface (DeGusta & Vrba, 2005).
HP: Proximal Height took on the ventral dimension of the proximal articular end, perpendicular to its major proximal distal axis (DeGusta & Vrba, 2005).
Dp: Greatest depth of the proximal end (Von den Driesch, 1976).
HPAS: Height Proximal Articular Surface. Height of the lateral articular facet of the proximal end (the authors).
WPAS: Width Proximal Articular Surface. Width of the lateral articular facet of the proximal end (the authors).
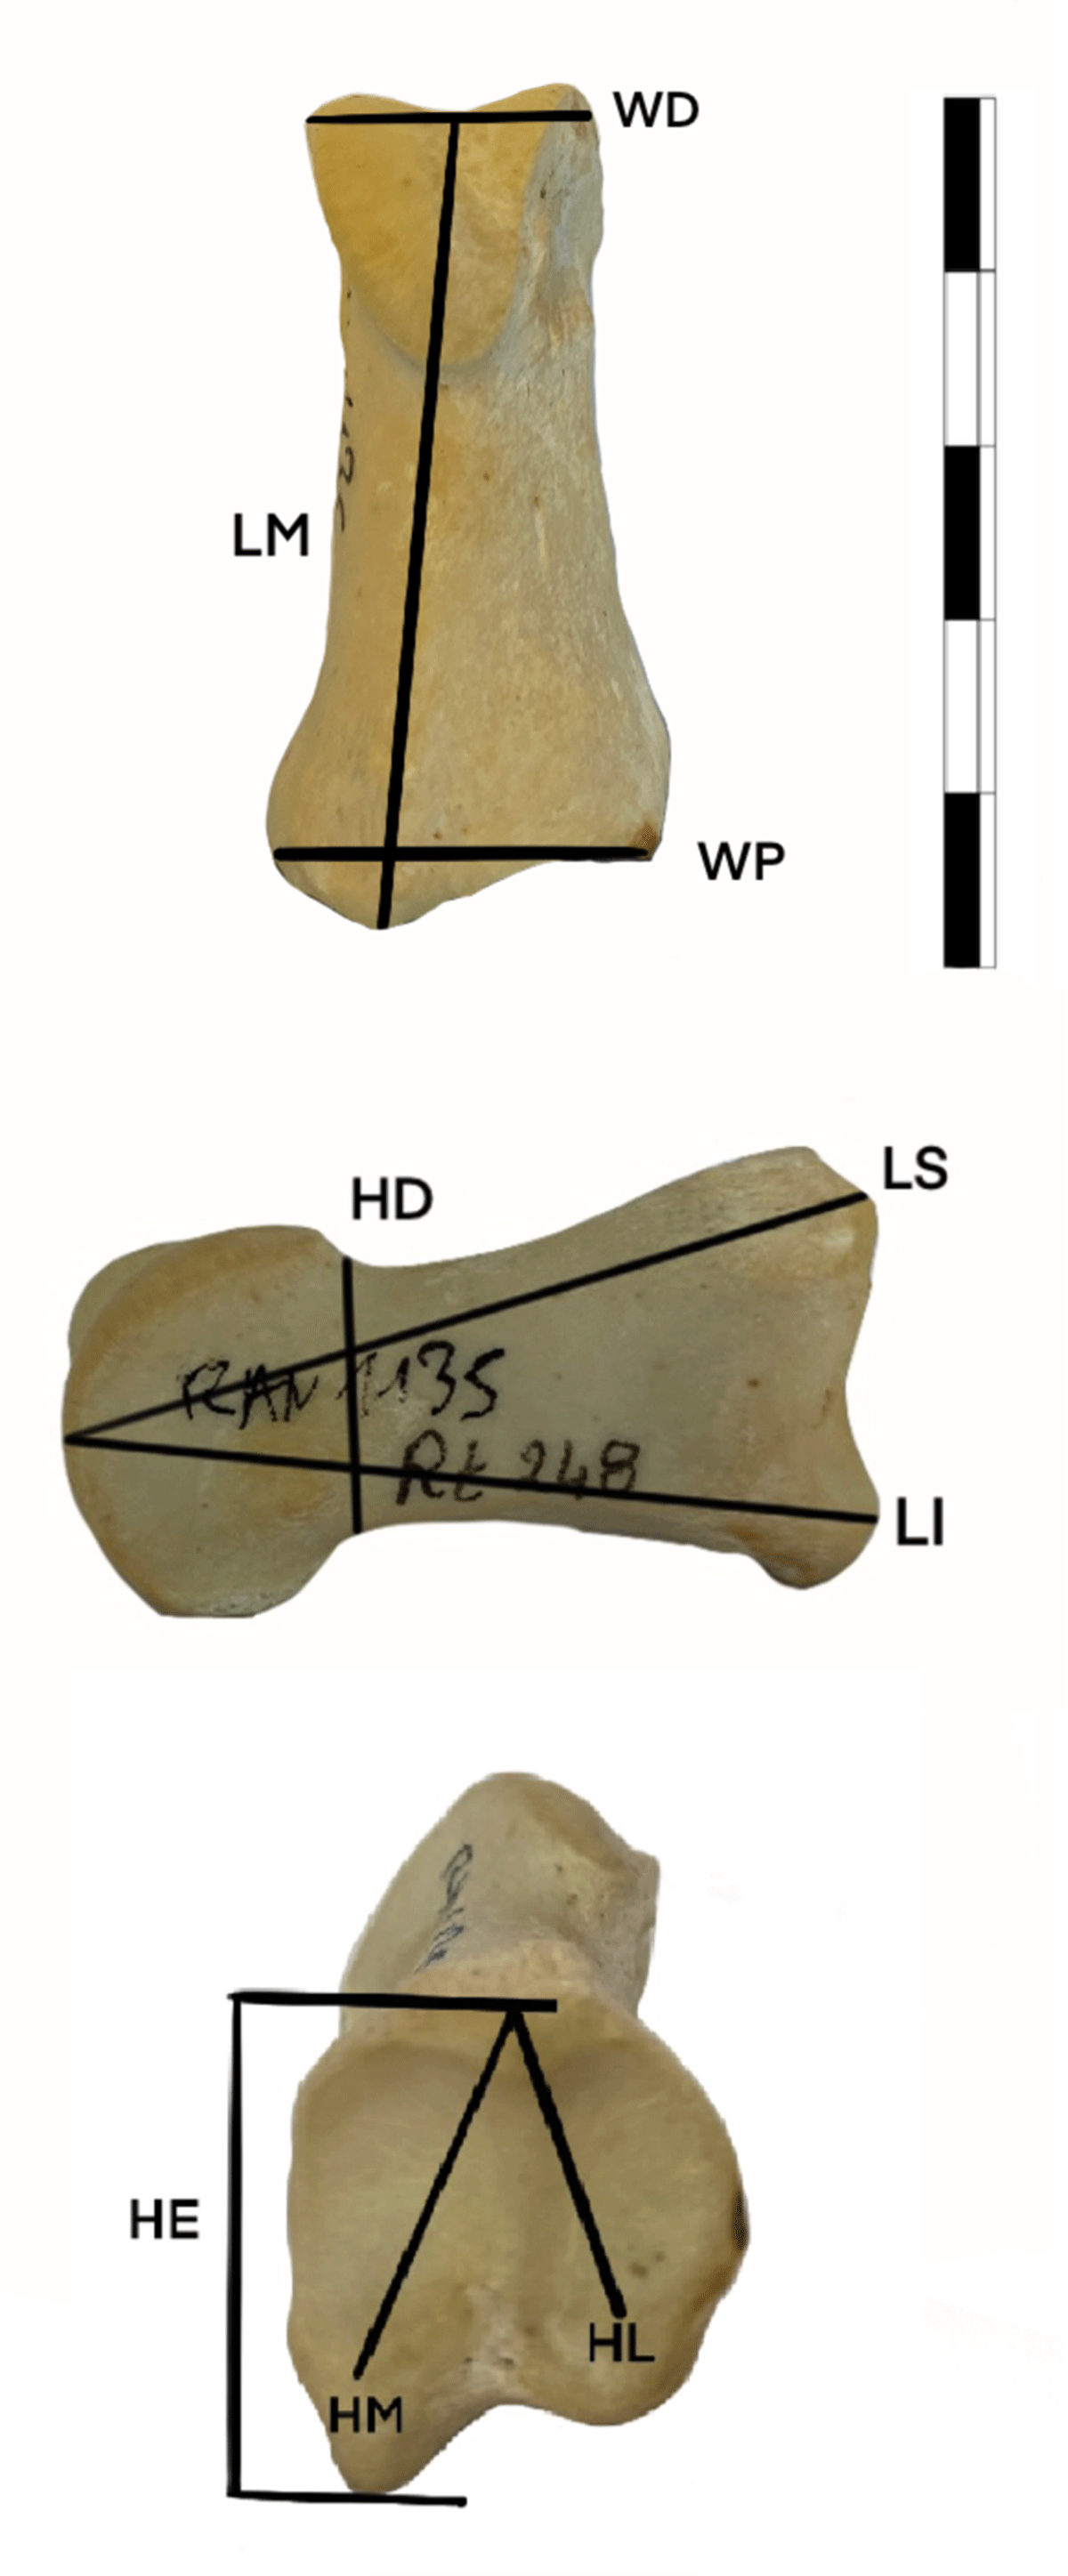
Figure 4
Measurements taken on second phalanges and described in the present work. See description Methods section of text.
GL: Greatest bone length (Von den Driesch, 1976).
LM: Midline Length. The minimum proximal distal dimension along the dorsal line.
Bd: Greatest breadth of the distal end (Von den Driesch, 1976).
LS: Superior Length- The proximal distal dimension of the dorsal surface, measured from the most proximal midline point of the dorsal surface of the proximal end to the most distal midline point on the distal articular surface (DeGusta & Vrba, 2005).
LI: Inferior Length- The proximal distal dimension of the ventral surface, measured from the most proximal midline point of the ventral surface of the proximal end to the most distal midline point on the distal articular surface (DeGusta & Vrba, 2005).
HD: Distal Height -The dorsal ventral dimension of the distal end, measured just proximal to the distal articular surface (DeGusta & Vrba, 2005).
HL: Lateral Height- The dorsal ventral dimension of the lateral portion of the proximal articular facet, measured from the most ventral point to the most dorsal point (DeGusta & Vrba, 2005).
HM: Medial Height -The dorsal ventral dimension of the medial portion of the proximal articular facet, measured from the most ventral point to the most dorsal point (DeGusta & Vrba, 2005).
Dp: Greatest depth of the proximal end (Von den Driesch, 1976).
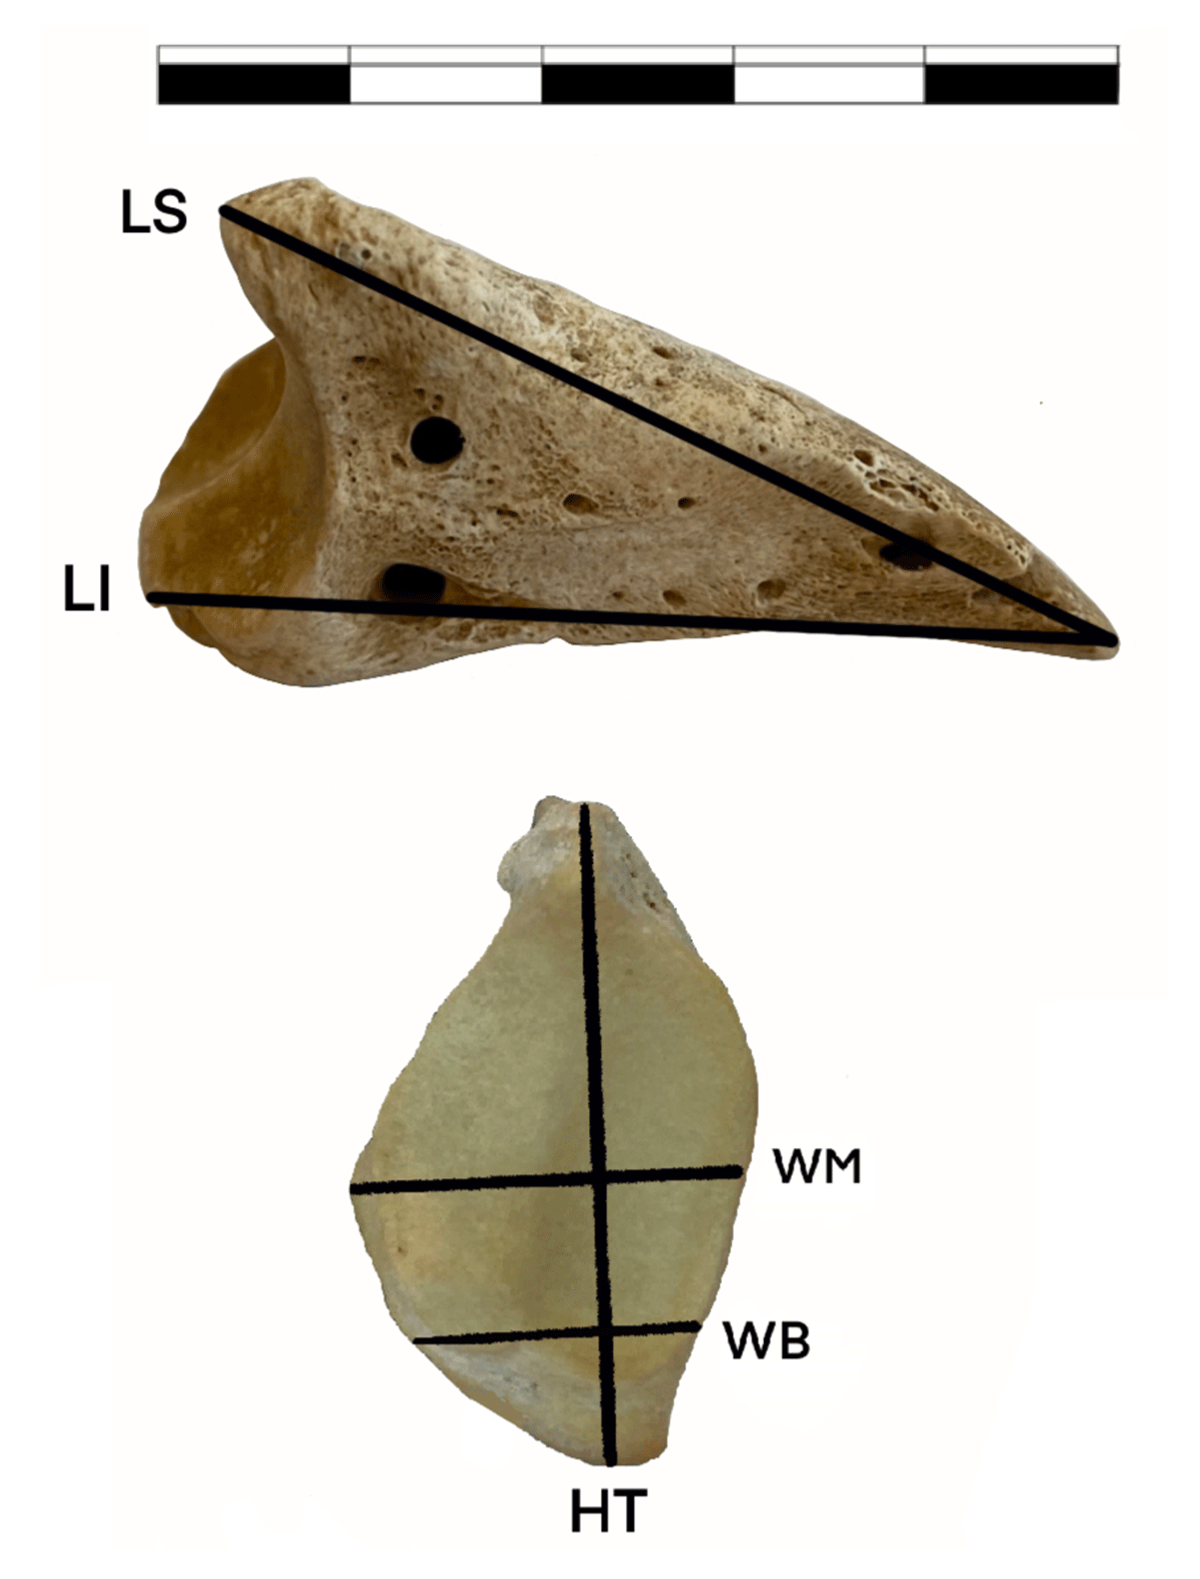
Figure 5
Measurements taken on third phalanges and described in the present work. See description Methods section of text.
Ld: Length of the dorsal surface (Von den Driesch, 1976).
LI: Inferior Length (DeGusta & Vrba, 2005).
HT: Total Height-The maximum ventral dorsal dimension of the proximal end (DeGusta & Vrba, 2005).
WB: Basal Width-The maximum medio-lateral dimension taken at the ventral base of the proximal articular facet (DeGusta & Vrba, 2005).
WM: Medium Width, taken in the middle of the proximal articular surface (the authors).
Table 2
Codes used in this study.
| CODE | MEANING |
|---|---|
| Rtcaribou_MS | Rangifer tarandus caribou Mountain Sedentary |
| Rtcaribou_BS | Rangifer tarandus caribou BorealForest Sedentary |
| Rtpeary_TM | Rangifer tarandus peary Tundra Migratory |
| Rtgroenlandicus_TM | Rangifer tarandus groenlandicus Tundra Migratory |
| Rtgranti_TM | Rangifer tarandus granti Tundra Migratory |
| Rtcaribou_MM | Rangifer tarandus caribou Mountain Migratory |
| Rtcaribou_TM | Rangifer tarandus caribou Tundra Migratory |
Table 3
Two-way Manova on metatarsal and metacarpals. Significant level <0.05.
| MANOVA | ||||
|---|---|---|---|---|
| DF | TEST STATISTIC (WILKS’LAMBDA) | F | P | |
| Metacarpus | ||||
| Subspecies | 3 | 0.07825 | 7.6557 | 1.310e–13 |
| Pattern | 1 | 0.37433 | 9.3123 | 9.941e–07 |
| Habitat | 2 | 0.72408 | 0.9760 | 0.4852 |
| Metatarsus | ||||
| Subspecies | 3 | 0.0589 | 9.9272 | <2.2e–16 |
| Pattern | 1 | 0.48365 | 6.5583 | 2.749e–05 |
| Habitat | 2 | 0.51972 | 2.3780 | 0.007576 |
Table 4
One way PERMANOVA to test statistically significant differences for anterior and posterior phalanges. Significant level <0.05.
| PERMANOVA | |||||
|---|---|---|---|---|---|
| DF | MEAN SQUARE | F | R2 | P | |
| Anterior posterior 1st phalanx | 1 | 4.497 | 10.81 | 0.070 | 0.003 |
| Anterior posterior 2nd phalanx | 1 | 6.638 | 18.07 | 0.135 | 0.001 |
| Anterior posterior 3rd phalanx | 1 | 0.090 | 0.28 | 0.006 | 0.834 |
Table 5
Performance of machine learning algorithms depending on the skeletal part to separate anterior and posterior first and second phalanges.
| BONE | MEASUREMENTS | ALGORITHM | ACCURACY | KAPPA | 95%CI | SENSITIVITY | SPECIFICITY | BALANCED ACCURACY |
|---|---|---|---|---|---|---|---|---|
| First Phalanx | All | Support Vector Machines | 97.7% | 0.95 | 0.87–0.99 | 1 | 0.95 | 0.97 |
| Proximal | Support Vector Machines | 90.7% | 0.81 | 0.77–0.97 | 0.89 | 0.91 | 0.90 | |
| Proximal | Neural Network | 93% | 0.85 | 0.80–0.98 | 0.89 | 0.95 | 0.92 | |
| Distal | Support Vector Machines | 65% | 0.24 | 0.49–0.78 | 0.31 | 0.91 | 0.61 | |
| Second Phalanx | All | Blending | 94% | 0.87 | 0.80–0.99 | 0.85 | 1 | 0.92 |
| Proximal | Extreme Gradient Boosting Tree | 65% | 0.26 | 0.47–0.80 | 0.50 | 0.76 | 0.63 |
Table 6
Two-way PERMANOVA on phalanges. Significant level <0.05.
| PERMANOVA | |||||
|---|---|---|---|---|---|
| DF | MEAN SQUARE | F | R2 | P | |
| Anterior First phalanx | |||||
| Subspecies | 3 | 6.07 | 23.43 | 0.51 | 0.001 |
| Pattern | 1 | 2.26 | 9.48 | 0.06 | 0.002 |
| Habitat | 2 | 0.97 | 4.06 | 0.05 | 0.009 |
| Posterior First phalanx | |||||
| Subspecies | 3 | 7.71 | 31.53 | 0.51 | 0.001 |
| Pattern | 1 | 0.56 | 2.32 | 0.01 | 0.118 |
| Habitat | 2 | 1.88 | 7.71 | 0.08 | 0.002 |
| Anterior Second phalanx | |||||
| Subspecies | 2 | 4.71 | 15.31 | 0.42 | 0.001 |
| Pattern | 1 | 0.71 | 2.31 | 0.03 | 0.121 |
| Habitat | 2 | 0.21 | 0.70 | 0.01 | 0.529 |
| Posterior Second phalanx | |||||
| Subspecies | 1 | 3.11 | 8.33 | 0.13 | 0.003 |
| Pattern | 1 | 1.10 | 2.94 | 0.04 | 0.067 |
| Habitat | 1 | 0.35 | 0.94 | 0.01 | 0.377 |
| Third phalanx | |||||
| Subspecies | 2 | 2.26 | 14.02 | 0.26 | 0.001 |
| Pattern | 1 | 0.56 | 3.48 | 0.03 | 0.024 |
| Habitat | 2 | 1.13 | 7.05 | 0.13 | 0.001 |
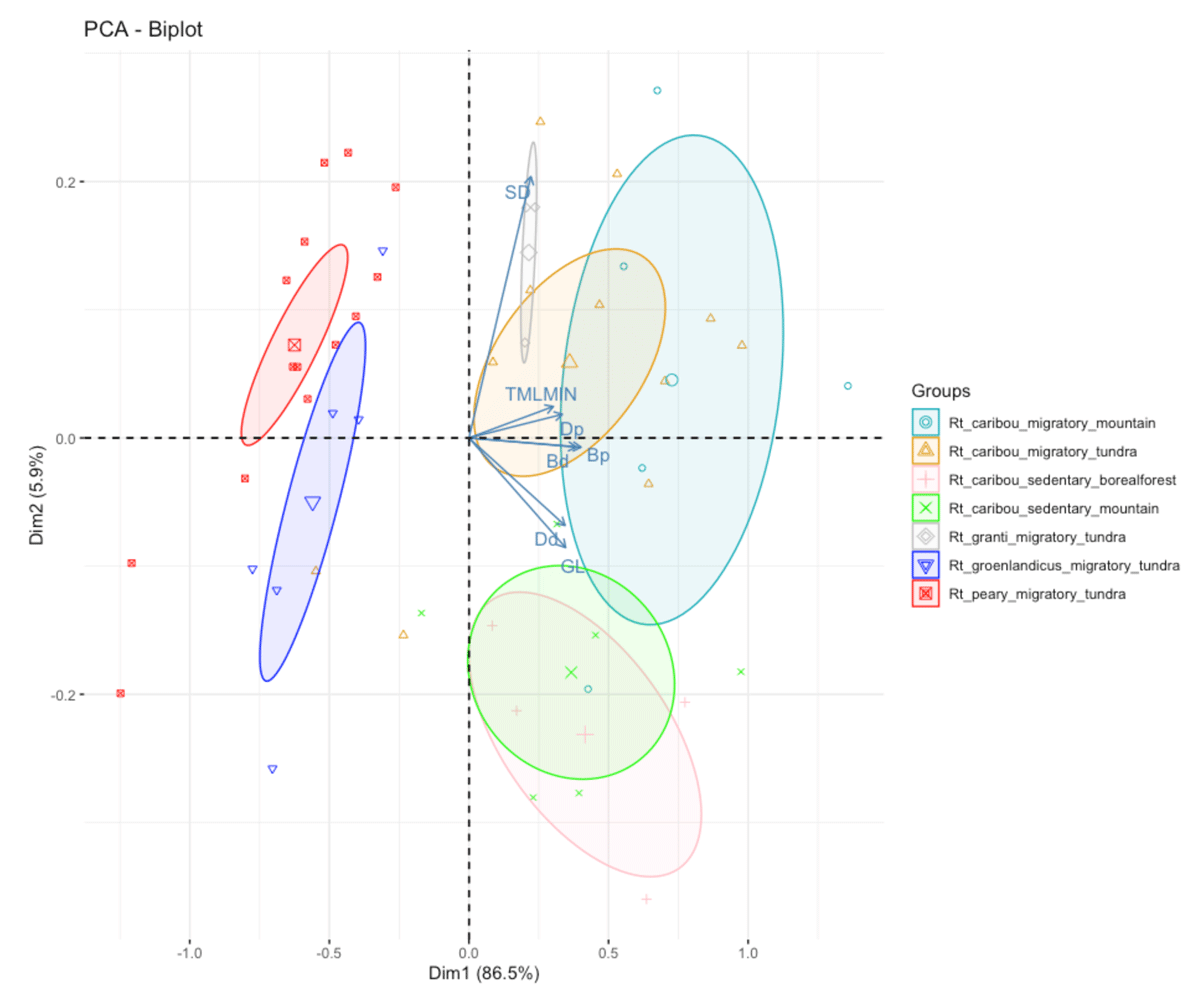
Figure 6
Principal Component Analysis on metacarpals. The seven groups take into account subspecies, habitat and mobility.
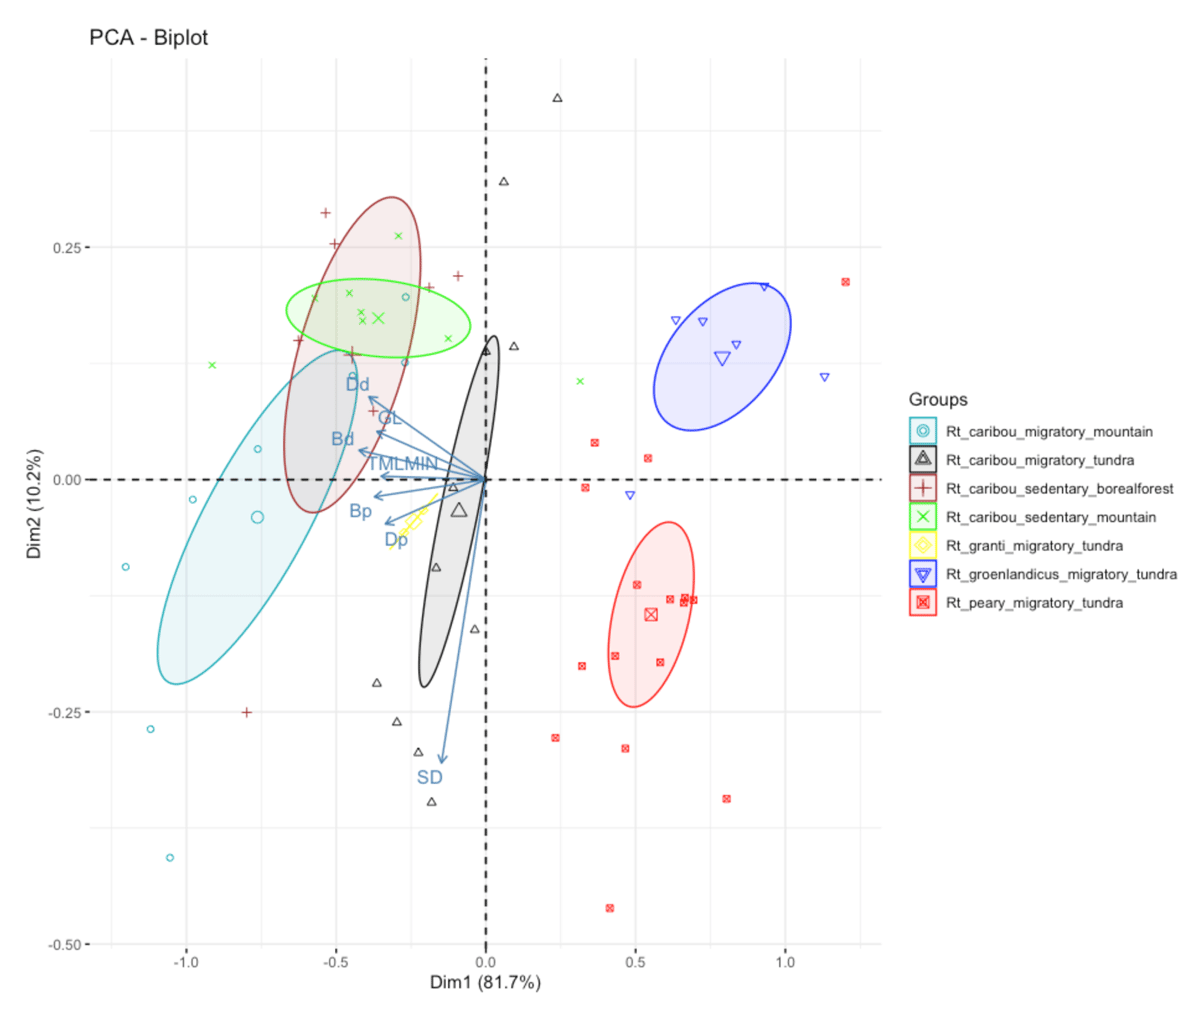
Figure 7
Principal Component analysis on metatarsals. The seven groups take into account subspecies, habitat and mobility.
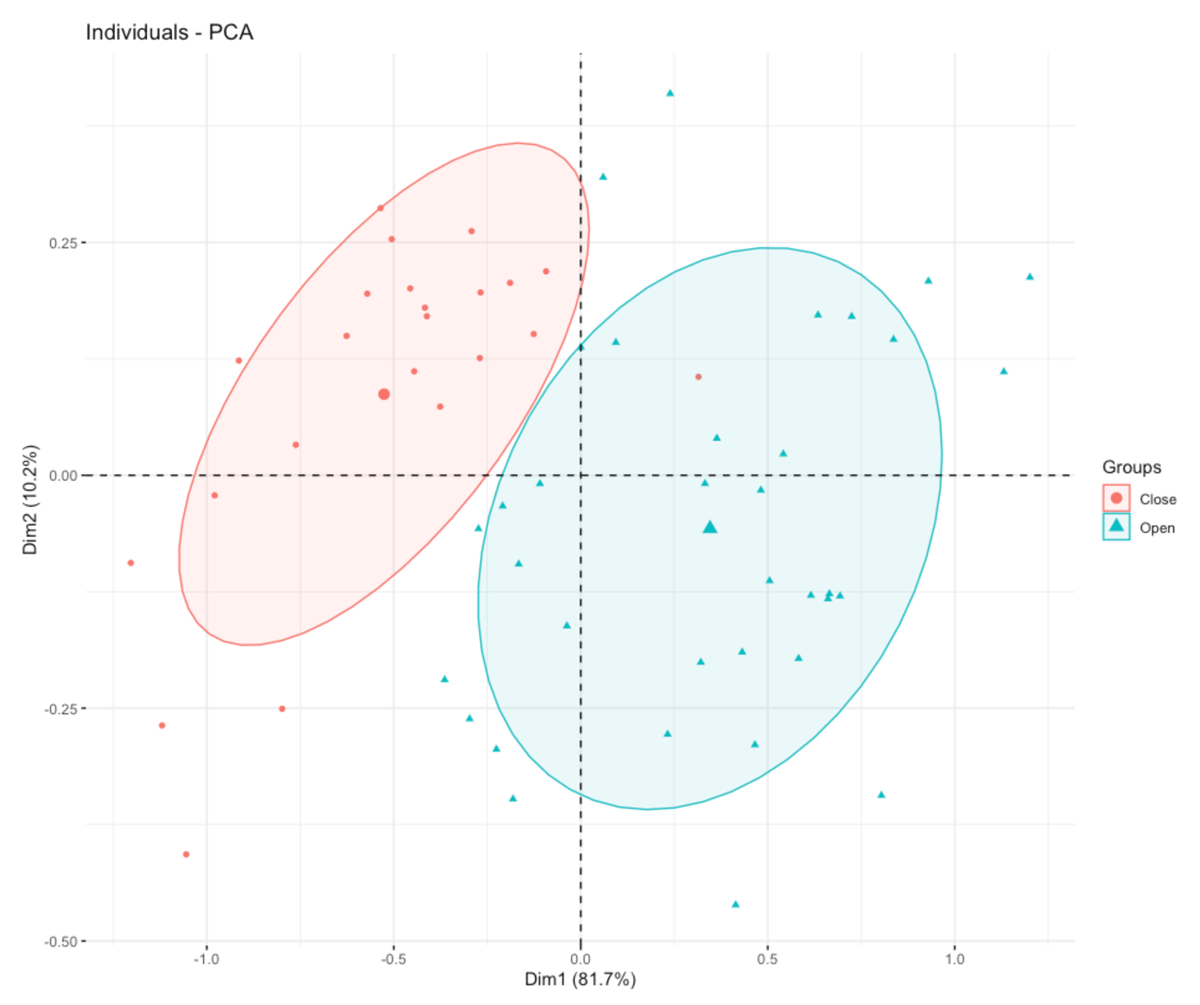
Figure 8
Principal Component Analysis on metatarsals. According to habitat (dichotomy open-close).
Table 7
Details on the performance of Machine Learning algorithms according to mobiliy pattern (migratory/sedentary) as predictor variable.
| BONE | MEASUREMENTS | ALGORITHM | ACCURACY | KAPPA | 95%CI | SENSITIVITY | SPECIFICITY | BALANCED ACCURACY |
|---|---|---|---|---|---|---|---|---|
| Metacarpus | Complete | Stacking | 90,4% | 0.76 | 0.69–0.98 | 0.87 | 1 | 0.93 |
| Metacarpus | Proximal | XgbTree | 95,2% | 0.85 | 0.76–0.99 | 1 | 0.80 | 0.90 |
| Metacarpus | Distal | Neural Network and Blending | 90% | 0.73 | 0.68–0.98 | 0.87 | 1 | 0.93 |
| Metatarsus | All | Random Forest | 86,9% | 0.59 | 0.66–0.97 | 1 | 0.50 | 0.75 |
| Metatarsus | Proximal | Stacking | 82% | 0.42 | 0.61–0.95 | 1 | 0.33 | 0.66 |
| Metatarsus | Distal | Support Vector Machines | 91,3% | 0.77 | 0.71–0.98 | 0.94 | 0.83 | 0.88 |
| Anterior First Phalanx | All | Stacking | 90% | 0.80 | 0.70–0.98 | 0.92 | 0.87 | 0.9 |
| Posterior First Phalanx | All | Stacking | 91,3% | 0.77 | 0.71–0.98 | 0.94 | 0.83 | 0.88 |
| Anterior Second Phalanx | All | Neural Network | 88,2% | 0.76 | 0.63–0.98 | 1 | 0.81 | 0.90 |
| Proximal | Blending | 88% | 0.74 | 0.63–0.98 | 0.9 | 0.83 | 0.87 | |
| Distal | Stacking | 76% | 0.48 | 0.50–0.93 | 0.81 | 0.66 | 0.74 | |
| Posterior Second Phalanx | All | Neural Network | 93,3% | 0.86 | 0.68–0.99 | 1 | 0.88 | 0.94 |
| Third Phalanx | All | Extreme Gradient Boosting Tree | 92% | 0.78 | 0.73–0.99 | 1 | 0.71 | 0.85 |
| Proximal | Stacking | 80% | 0.52 | 0.59–0.93 | 0.83 | 0.71 | 0.77 |
Table 8
Details on the performance of Machine Learning algorithms according to habitat (open/close) as predictor variable.
| BONE | MEASUREMENTS | ALGORITHM | ACCURACY | KAPPA | 95%CI | SENSITIVITY | SPECIFICITY | BALANCED ACCURACY |
|---|---|---|---|---|---|---|---|---|
| Metatarsus | Distal | Support Vector Machines | 93,75% | 0.87 | 0–69–0.99 | 1 | 0.9 | 0.95 |
| Anterior First Phalanx | All | Support Vector Machines | 91,6% | 0.83 | 0.73–0.98 | 1 | 0.83 | 0.91 |
| Posterior First Phalanx | All | Stacking | 95,6% | 0.91 | 0.78–0.99 | 0.91 | 1 | 0.95 |
| Distal | Blending | 82% | 0.64 | 0.61–0.95 | 0.91 | 0.72 | 0.82 | |
| Proximal | Blending | 86% | 0.74 | 0.66–0.97 | 0.75 | 1 | 0.87 | |
| Anterior Second Phalanx | All | Blending | 76% | 0.54 | 0.50–0.93 | 1 | 0.55 | 0.77 |
| Third Phalanx | All | Support Vector Machines | 95.8% | 0.91 | 0.78–0.99 | 1 | 0.92 | 0.96 |
Table 9
Classification results for proximal metacarpal according to XgbTree algorithm.
| BONE TYPE | BONE REFERENCE | ALGORITHM | MIGRATORY | SEDENTARY | CLASSIFICATION |
|---|---|---|---|---|---|
| Mtc proximal | R11e–874 | XgbTree | 0.9418254 | 0.05817461 | Migratory |
| Mtc proximal | S6d–716 | XgbTree | 0.9418254 | 0.05817461 | Migratory |
| Mtc proximal | Q12f–972 | XgbTree | 0.9418254 | 0.05817461 | Migratory |
| Mtc proximal | N8d–1237 | XgbTree | 0.9418254 | 0.05817461 | Migratory |
Table 10
Classification results for distal metacarpal (mobility pattern) and distal metatarsal (Mobility pattern and Habitat) according to SVM and NN algorithms. See Results section to key accuracies and Kappa values.
| BONE TYPE | BONE REFERENCE | ALGORITHM | MOBILITY PATTERN CLASSIFICATION | HABITAT CLASSIFICATION |
|---|---|---|---|---|
| Mtc distal | T6c–200 | NN | Migratory | – |
| Mtc distal | O9d–658 | NN | Sedentary | – |
| Mtc distal | N10h | NN | Migratory | – |
| Mtc distal | Q12d–591 | NN | Migratory | – |
| Mtc distal | O8e inf–1837 | NN | Migratory | – |
| Mtc distal | Q12f–971 | NN | Migratory | – |
| Mtc distal | R11c–441 | NN | Migratory | – |
| Mtc distal | O8c–717 | NN | Sedentary | – |
| Mtc distal | S5d–590 | NN | Migratory | – |
| Mtc distal | M8e–484 | NN | Migratory | – |
| Mtc distal | M8e–474 | NN | Migratory | – |
| Mtc distal | Q9d–763 | NN | Migratory | – |
| Mtt distal | P9c–116 | SVM | Migratory | Open |
| Mtt distal | R10c–494 | SVM | Migratory | Open |
| Mtt distal | T6c–163 | SVM | Migratory | Open |
| Mtt distal | R11e–1745 | SVM | Migratory | Open |
| Mtt distal | O8e inf–1745 | SVM | Migratory | Open |
| Mtt distal | O8e inf–1824 | SVM | Migratory | Open |
| Mtt distal | O9c–253 | SVM | Migratory | Open |
| Mtt distal | S10f inf–95 | SVM | Migratory | Open |
| Mtt distal | T11f–7 | SVM | Migratory | Open |
| Mtt distal | O8d–1467 | SVM | Migratory | Open |
| Mtt distal | N8c–387 | SVM | Migratory | Open |
| Mtt distal | N7c–176 | SVM | Migratory | Open |
| Mtt distal | M8c –57 | SVM | Migratory | Open |