
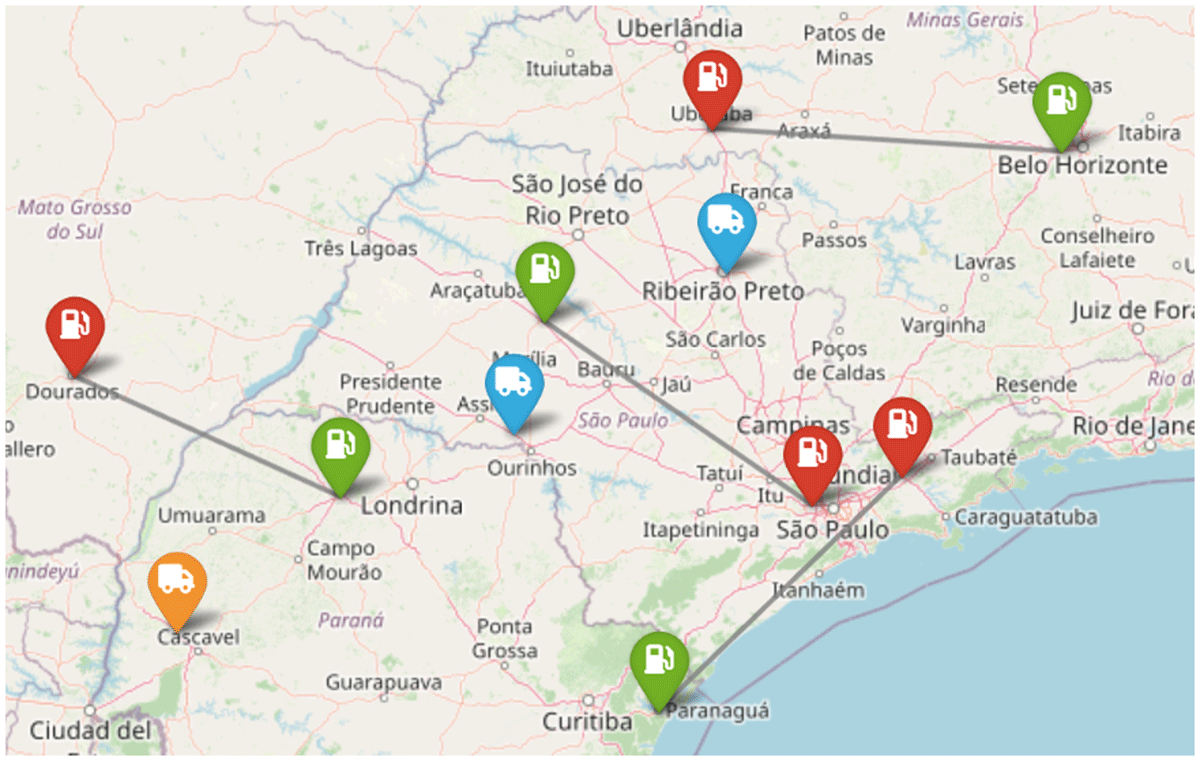
Figure 1
Conceptual formulation of an instance.
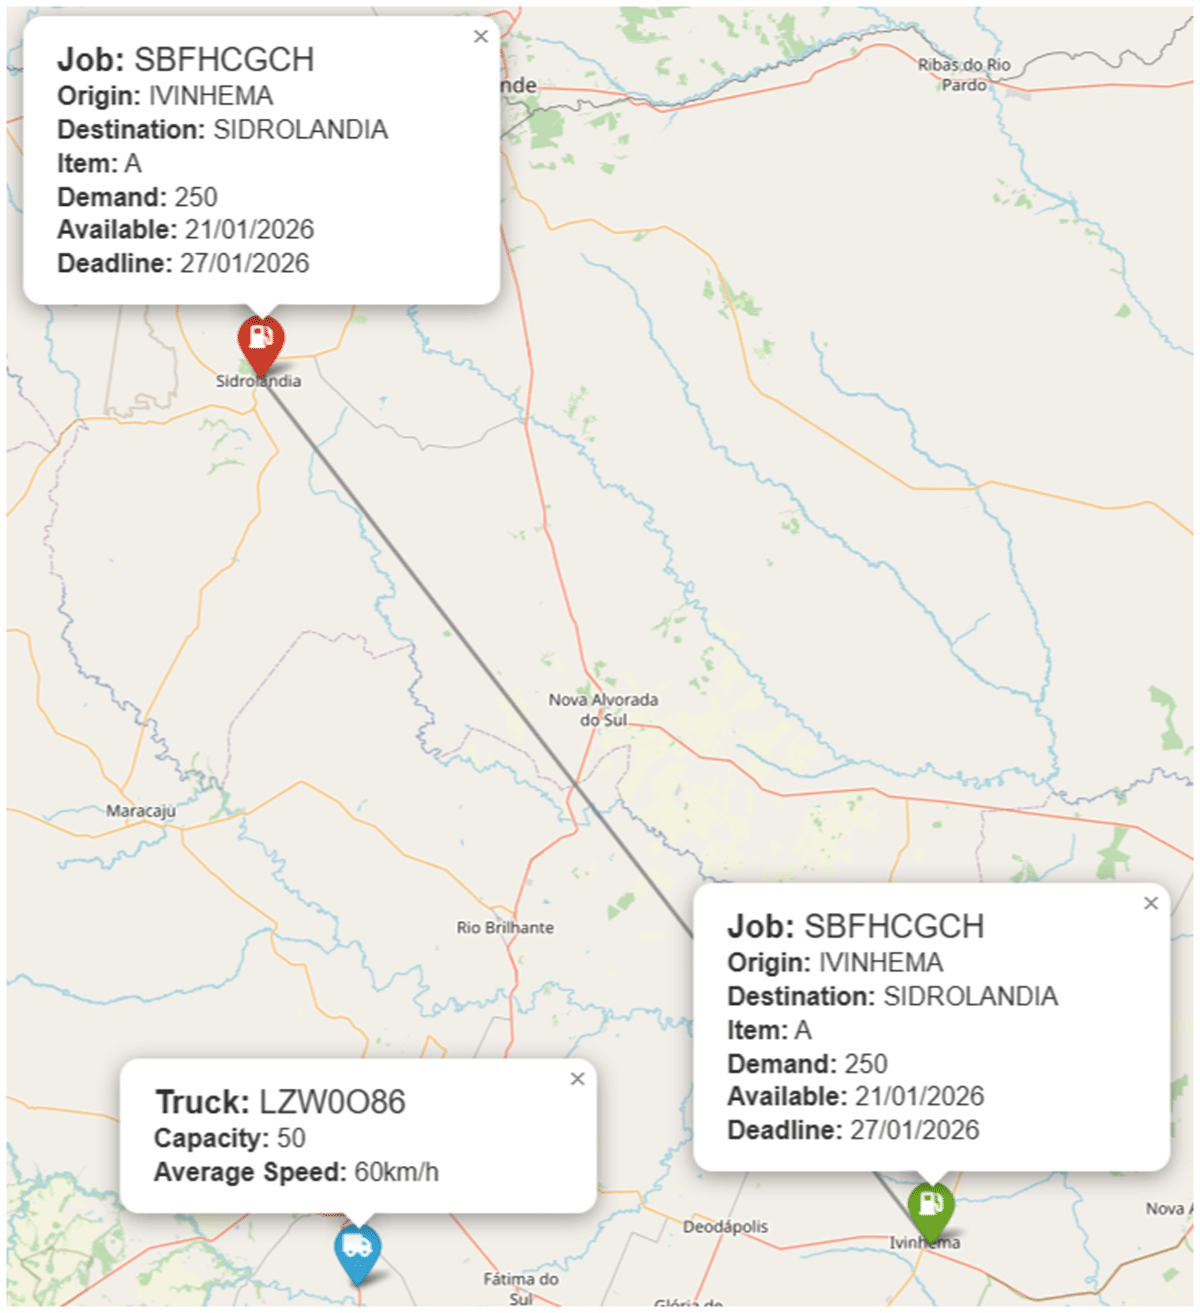
Figure 2
Conceptual formulation of instance parameters for a request and a truck.
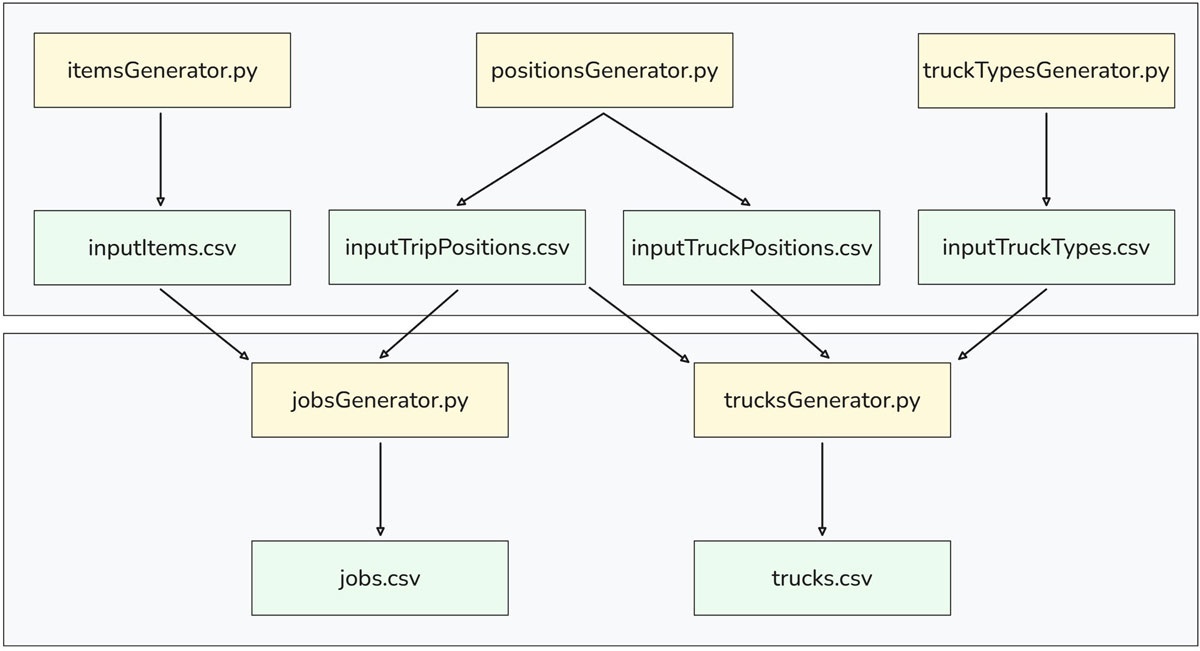
Figure 3
Flow chart of instance generation of BigVRSP.
Table 1
Data format for inputTruckTypes.csv.
| Field | Type | Description |
|---|---|---|
| truck_type_id | str | Vehicle type identifier |
| truck_weight | int | Weight of the unloaded truck |
| truck_capacity | int | Maximum cargo capacity |
| average_unloaded_speed | float | Average speed when unloaded |
| average_loaded_speed | float | Average speed when fully loaded |
| average_unloaded_fuel_efficiency | float | Fuel efficiency when unloaded |
| average_loaded_fuel_efficiency | float | Fuel efficiency when fully loaded |
| probability | float | Selection probability in final instance |
Table 2
Data format for inputTripPositions.csv.
| Field | Type | Description |
|---|---|---|
| origin | str | City name of the origin location |
| origin_latitude | float | Latitude coordinate of the origin |
| origin_longitude | float | Longitude coordinate of the origin |
| destination | str | City name of the destination location |
| destination_latitude | float | Latitude coordinate of the destination |
| destination_longitude | float | Longitude coordinate of the destination |
| probability | float | Probability of choosing this position |
Table 3
Data format for inputTruckPositions.csv.
| Field | Type | Description |
|---|---|---|
| location | str | City name of the truck position |
| latitude | float | Latitude coordinate of the truck |
| longitude | float | Longitude coordinate of the truck |
| probability | float | Probability of choosing this position |
Table 4
Data format for inputItems.csv.
| Field | Type | Description |
|---|---|---|
| item | str | Item’s name or identifier |
| probability | float | Probability of choosing the item |
Table 5
Data format for trucks.csv.
| Field | Type | Description |
|---|---|---|
| truck_id | str | Vehicle identifier |
| truck_latitude | float | Truck’s current latitude position |
| truck_longitude | float | Truck’s current longitude position |
| destination | str | Parked or city name of the assigned destination |
| destination_latitude | float | Destination’s latitude |
| destination_longitude | float | Destination’s longitude |
| next_scheduled_maintenance | str | Date of the next scheduled maintenance (DD/MM/YYYY) |
| maintenance_days | int | Amount of days to complete the maintenance |
| truck_type_id | str | Identifier for the specific truck type |
| truck_capacity | float | Maximum cargo capacity |
| average_unloaded_speed | float | Average speed when empty |
| average_loaded_speed | float | Average speed when fully loaded |
| average_unloaded_fuel_efficiency | float | Fuel efficiency when empty |
| average_loaded_fuel_efficiency | float | Fuel efficiency when fully loaded |
| driven_kilometers | float | Truck’s driven kilometers quantity |
| current_month_revenue | float | Current month’s revenue from truck |
| current_month_work_hours | float | Current amount of hours worked by the driver |
| current_day_work_hours | float | Amount of worked hours in current day |
| current_week_work_days | float | Amount of worked days in current week |
Table 6
Data format for jobs.csv.
| Field | Type | Description |
|---|---|---|
| customer_id | str | Unique identifier for the customer or order |
| job_id | str | Unique identifier for the request |
| origin_name | str | City name of the pickup location |
| origin_latitude | float | Latitude of the pickup location |
| origin_longitude | float | Longitude of the pickup location |
| destination_name | str | City name of the delivery location |
| destination_latitude | float | Latitude of the delivery location |
| destination_longitude | float | Longitude of the delivery location |
| demand | int | Total required quantity of the item |
| serviced_demand | int | Current quantity of the item already delivered |
| item | str | Demanded item identifier |
| price_per_item | float | Value of a single unit of the item |
| min_demand_variation | float | Minimum acceptable variation in attended demand |
| max_demand_variation | float | Maximum acceptable variation in attended demand |
| has_own_valet | bool | Indicates if the customer has their own valet staff |
| pickup_start_date | str | First date available for pickup (DD/MM/YYYY) |
| delivery_deadline_date | str | Final date allowed for delivery (DD/MM/YYYY) |
| pickup_start | str | Earliest time of day for pickup |
| pickup_end | str | Latest time of day for pickup |
| delivery_start | str | Earliest time of day for delivery |
| delivery_end | str | Latest time of day for delivery |
Table 7
Generation wall time and output file size per number of records.
| jobsGenerator | trucksGenerator | |||
|---|---|---|---|---|
| Records | Time (s) | Size (Mb) | Time (s) | Size (Mb) |
| 102 | 0.16 | 0.02 | 0.07 | 0.01 |
| 103 | 0.30 | 0.16 | 0.09 | 0.10 |
| 104 | 1.78 | 1.59 | 0.21 | 1.01 |
| 105 | 15.52 | 15.92 | 1.44 | 10.05 |
| 106 | 168.11 | 159.23 | 17.47 | 100.54 |
Table 8
Results of the MILP usage example (usage_example.jl) solved with HiGHS over generated instances (seed 42, 300 s time limit). The columns ‘j’ and ‘t’ are, respectively, the number of jobs and trucks used, while the ‘Tasks’ column is the number of tasks after the expansion of jobs into pickup and delivery day combinations, and ‘Served’ is the fraction of the total demand transported.
| j | t | Tasks | Vars | Consts | Status | Gap | Time (s) | Served |
|---|---|---|---|---|---|---|---|---|
| 4 | 3 | 21 | 1 794 | 4 432 | Optimal | <10-4 | 1.6 | 94.5% |
| 6 | 4 | 27 | 3 712 | 9 534 | Time limit | 0.66% | 300 | 96.2% |
| 8 | 5 | 36 | 7 790 | 20 738 | Time limit | 0.83% | 300 | 95.1% |