

Figure 1
Depiction of the definition of the 8 MJO phases according to the position of the convection anomaly. The figure is taken from the original publication by Madden and Julian [9], where more details can also be found.
Table 1
Comparison of recalculated and original EOFs summarized over all DOYs. Note that we did not include numbers for the setup “strict leap year treatment/DOY 366 included”, since these numbers are only determined by the EOFs of DOY 366, which is intentionally different from the original. Hence, no conclusion on the overall agreement can be drawn from these numbers.
| EOF | INDICATOR | LEAP YEAR TREATMENT | DOY 366 | VALUE |
|---|---|---|---|---|
| 1 | Correlation | not strict | both | >0.994 |
| 2 | Correlation | not strict | both | >0.993 |
| 1 | 99% percentile | not strict | both | <0.0084 W/m2 |
| 2 | 99% percentile | not strict | both | <0.0065 W/m2 |
| 1 | Correlation | strict | excluded | >0.994 |
| 2 | Correlation | strict | excluded | >0.993 |
| 1 | 99% percentile | strict | excluded | <0.0084 W/m2 |
| 2 | 99% percentile | strict | excluded | <0.0065 W/m2 |
Table 2
Comparison of recalculated and original PCs considering the complete period of the available original data (01/01/1979 to 28/08/2018).
| PC | INDICATOR | LEAP YEAR TREATMENT | DOY 366 | VALUE |
|---|---|---|---|---|
| 1 | Correlation | not strict | both | >0.998 |
| 2 | Correlation | not strict | both | >0.998 |
| 1 | Std.-Dev. of difference | not strict | both | <0.0458 |
| 2 | Std.-Dev. of difference | not strict | both | <0.0488 |
| 1 | 99% percentile | not strict | both | <0.157 |
| 2 | 99% percentile | not strict | both | <0.1704 |
| 1 | Correlation | strict | excluded | >0.998 |
| 2 | Correlation | strict | excluded | >0.998 |
| 1 | Std.-Dev. of difference | strict | excluded | <0.0449 |
| 2 | Std.-Dev. of difference | strict | excluded | <0.0484 |
| 1 | 99% percentile | strict | excluded | <0.1523 |
| 2 | 99% percentile | strict | excluded | <0.1671 |
| 1 | Correlation | strict | included | >0.998 |
| 2 | Correlation | strict | included | >0.998 |
| 1 | Std.-Dev. of difference | strict | included | <0.0509 |
| 2 | Std.-Dev. of difference | strict | included | <0.0501 |
| 1 | 99% percentile | strict | included | <0.1552 |
| 2 | 99% percentile | strict | included | <0.1708 |
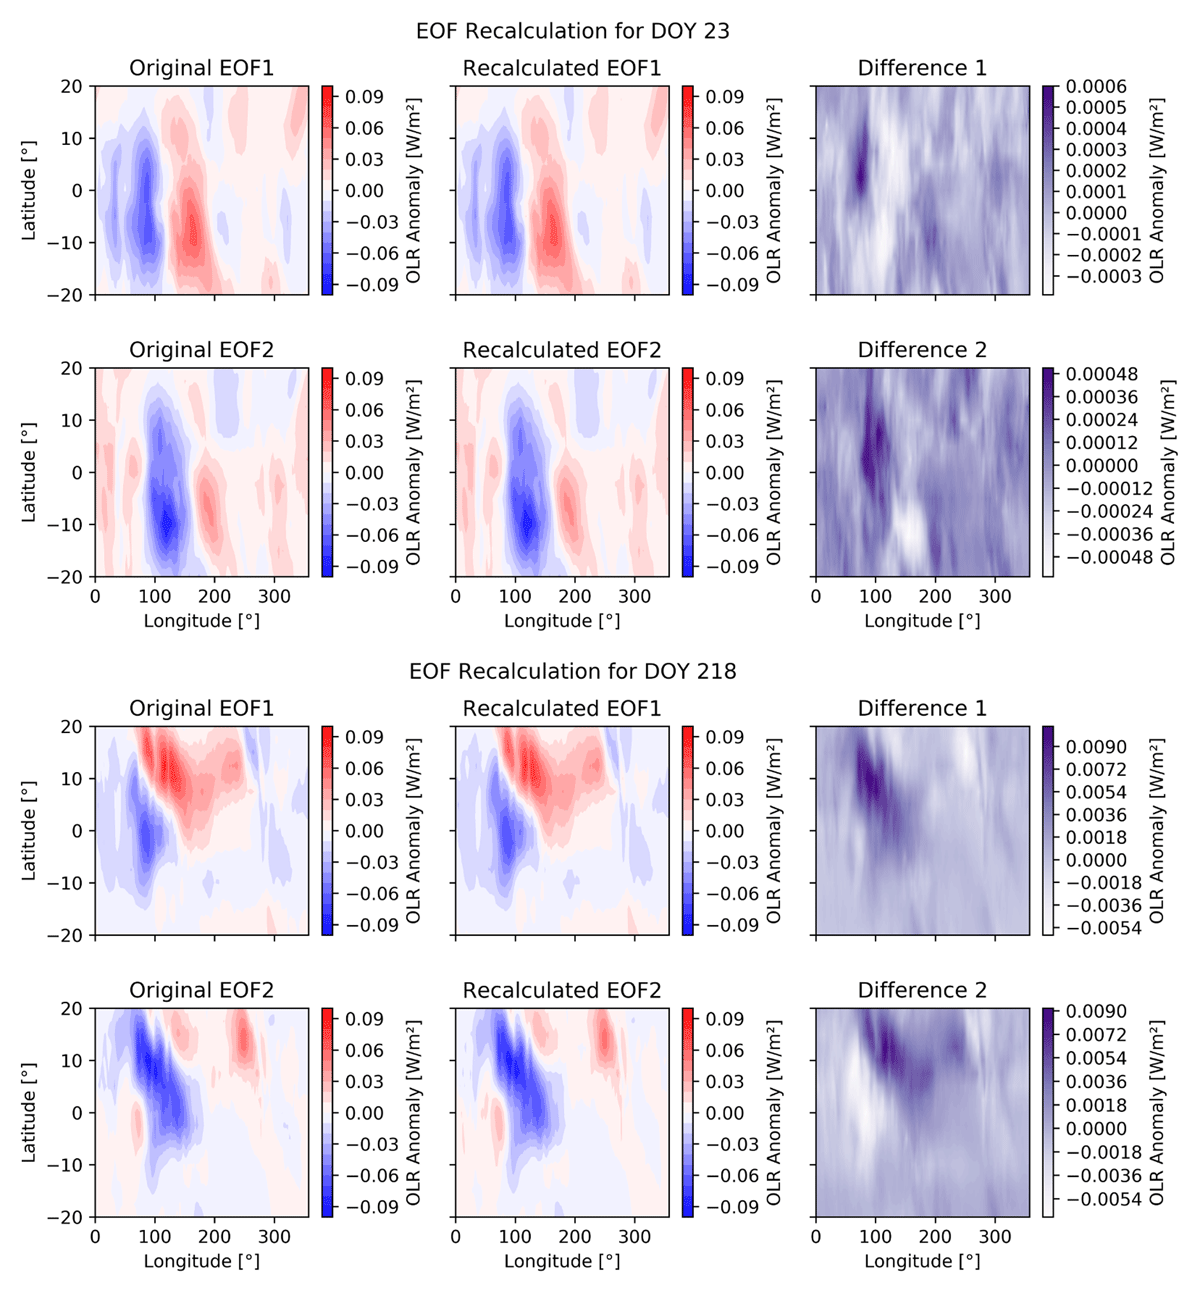
Figure 2
Examples of recalculated EOFs in comparison to the original EOFs for DOY 23, which is among the DOYs with the best agreement, and DOY 218, which has the worst agreement. Note that the color scale of the panels with the differences varies.
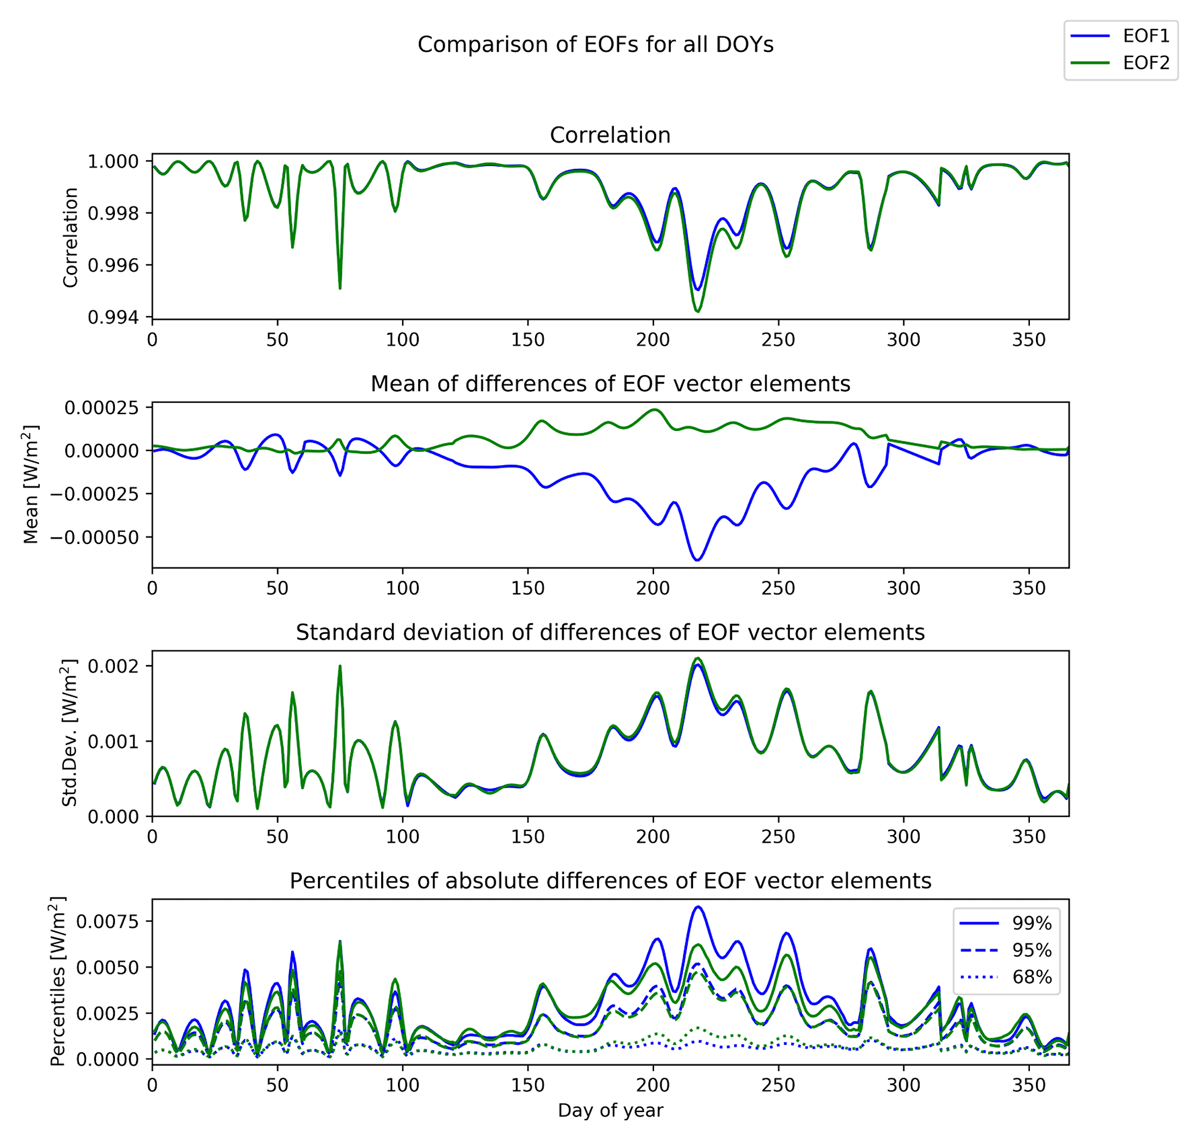
Figure 3
Detailed comparison statistics for the EOFs of all DOYs. See text for details.
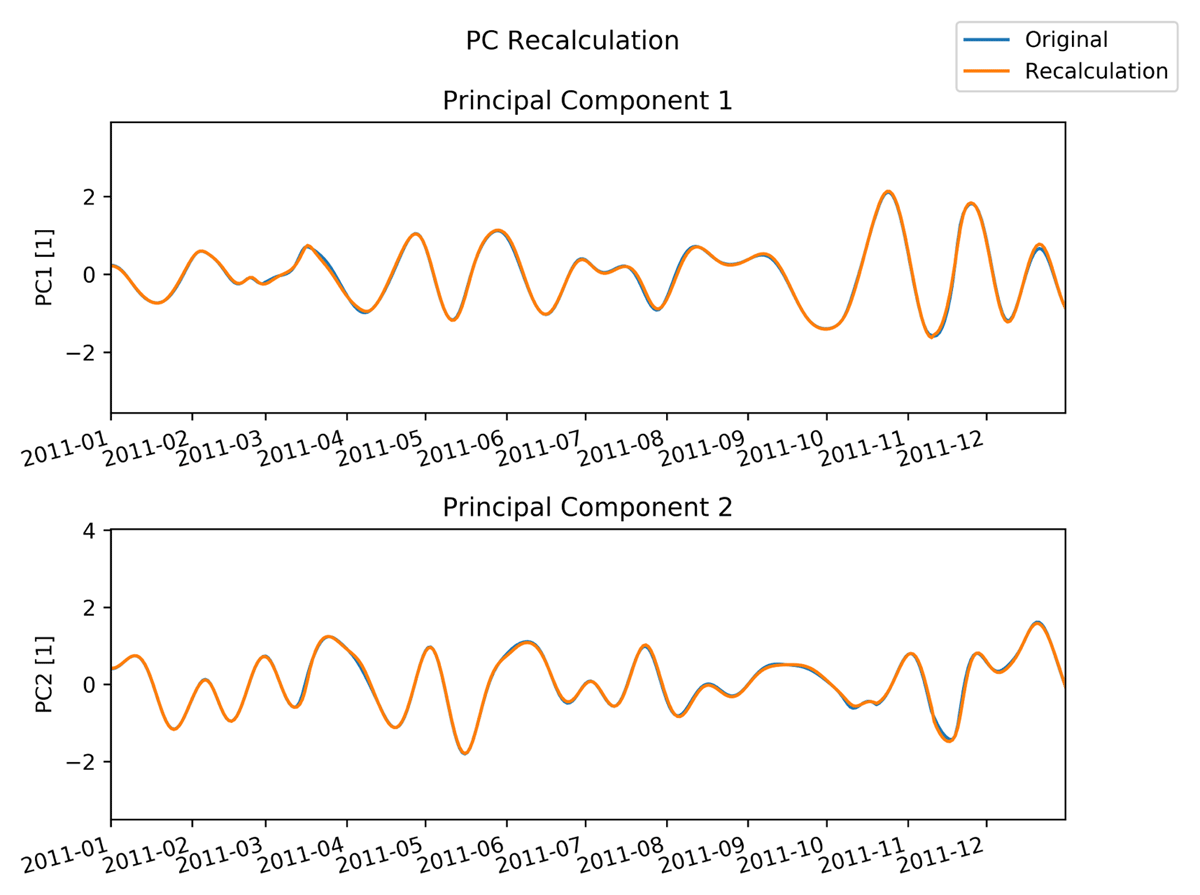
Figure 4
Comparison of the recalculated and original PCs for an arbitrarily chosen sample period (the year 2011).