
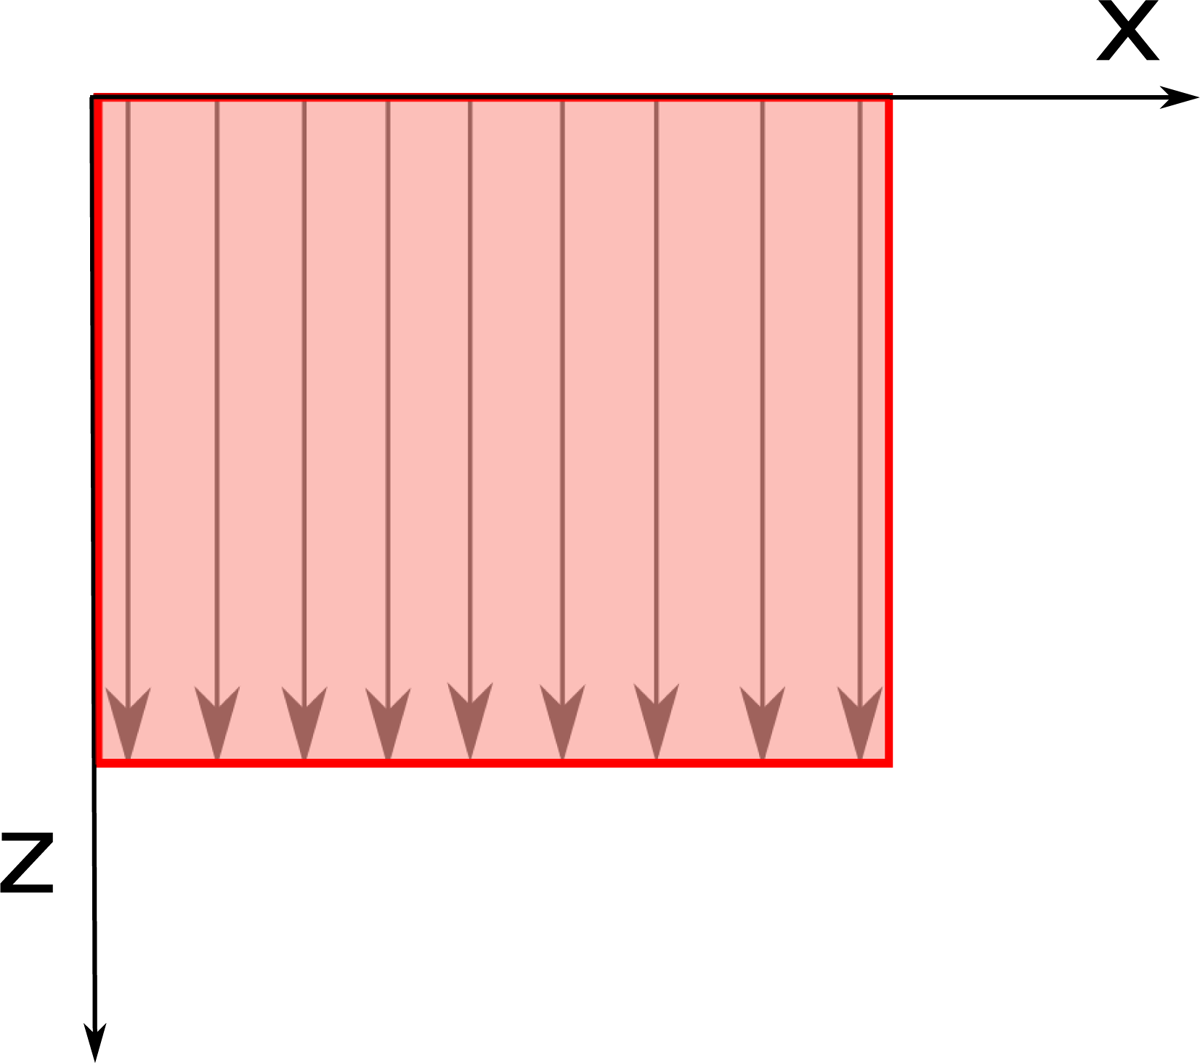
Figure 1
Illustration of A-scans and B-scans in OCT. The intensity plot of the sample reflectance from various depths along the arrows are A-scans, while the collection of A-scans in the shaded area is a B-scan. The downward z-axis is into the sample. The x-axis shows the lateral extent of the sample.
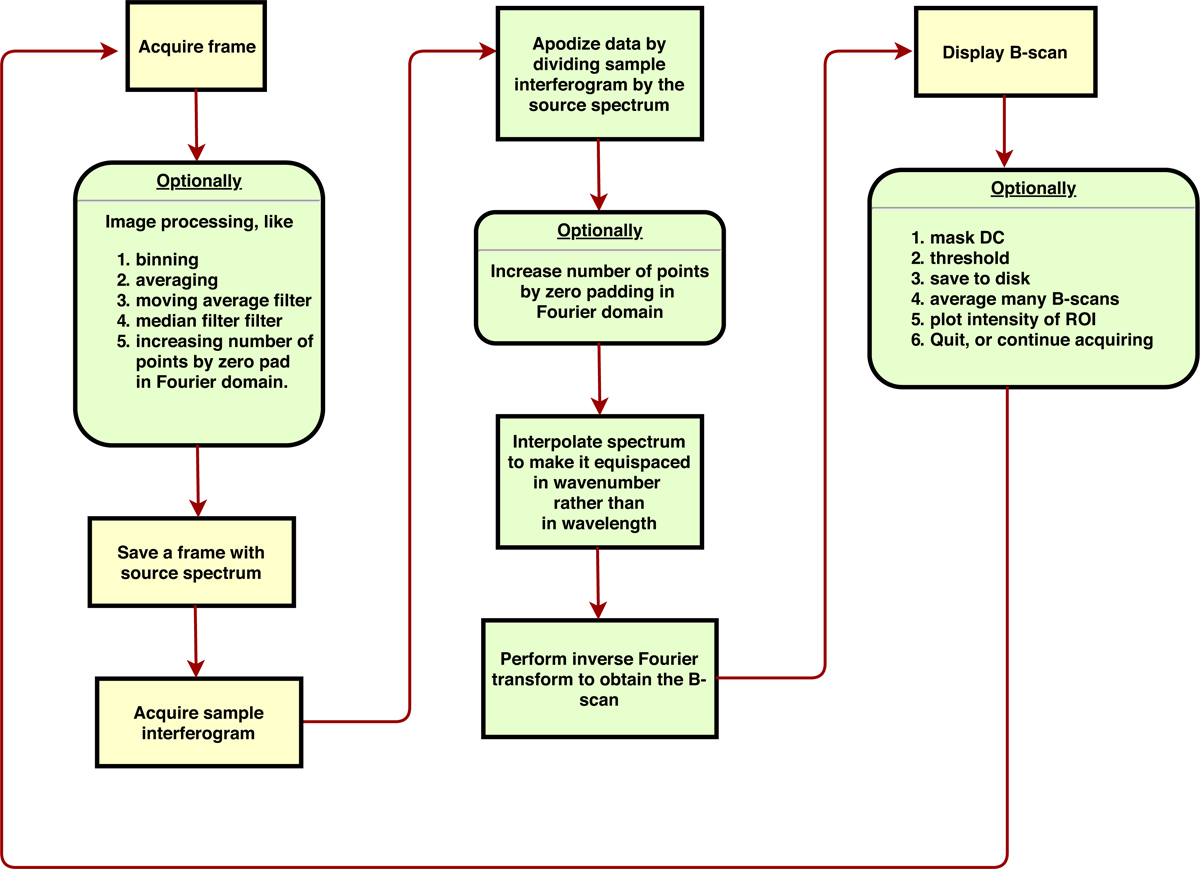
Figure 2
Flowchart of operations performed by our ABC-OCT software.
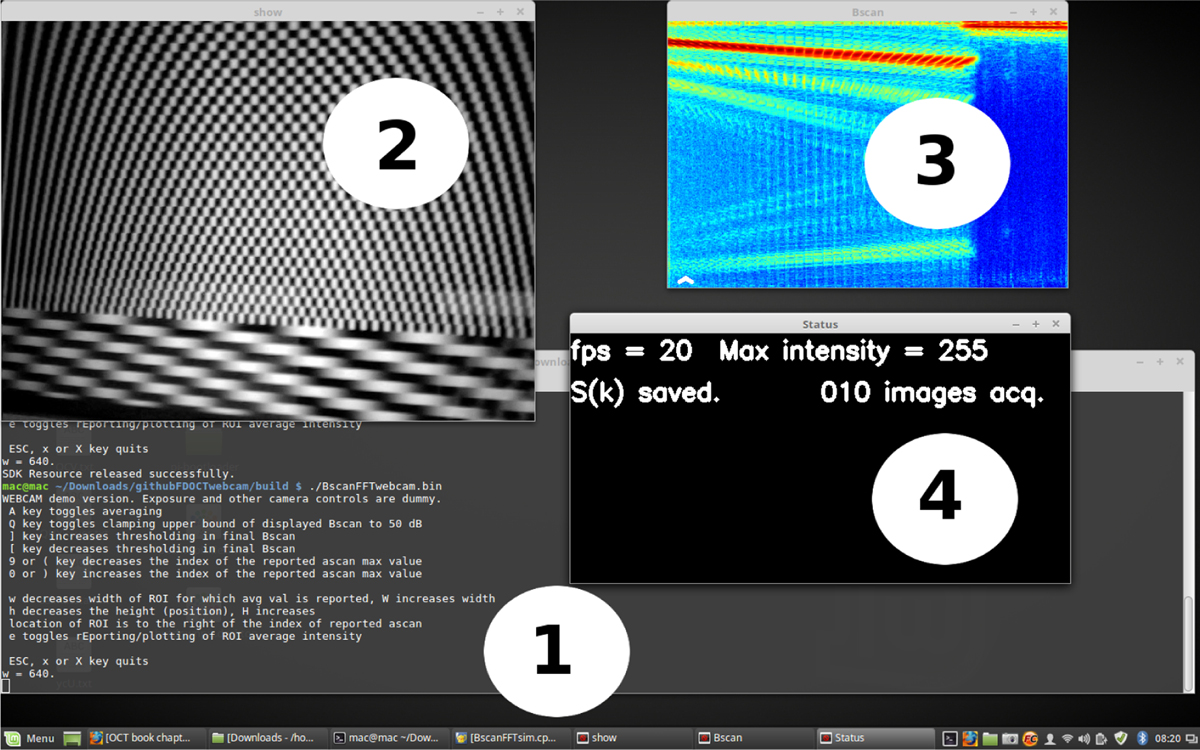
Figure 3
Screenshot of ABC-OCT in action. The labelled windows are – 1. Terminal window, where some status messages and error messages appear; 2. Display window, showing the camera view; 3. The computed B-scan in false colour; 4. Status window with information about capture parameters.