
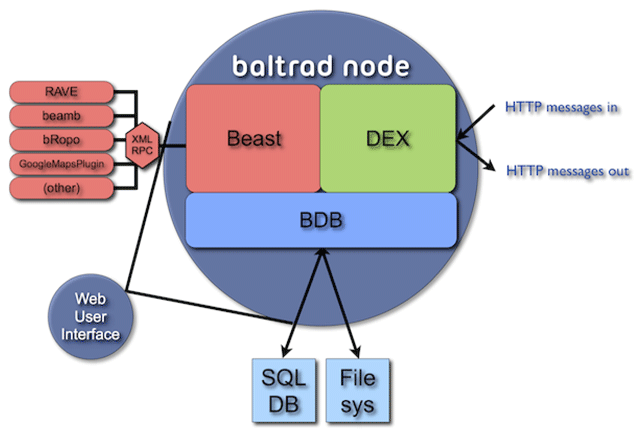
Figure 1
BALTRAD node subsystems. The BALTRAD Toolbox is labeled RAVE and is shown on the left together with some of its add-on packages.
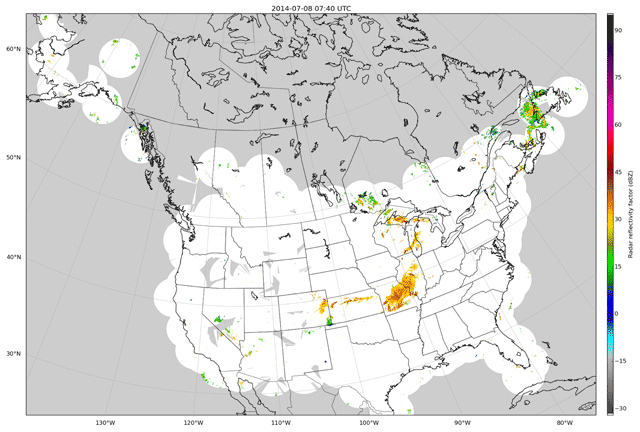
Figure 2
The BALTRAD Toolbox has been used with reflectivity data from 180 Canadian and American weather radars. Data have been quality controlled, and the derived quality information has been actively used when creating this composite product. July 8, 2014 at 07:40 UTC, showing storms over the American mid-west, the Great Lakes, and Atlantic Canada. Visualization has used Python’s matplotlib and basemap packages on the Open Radar Virtual Machine [15].
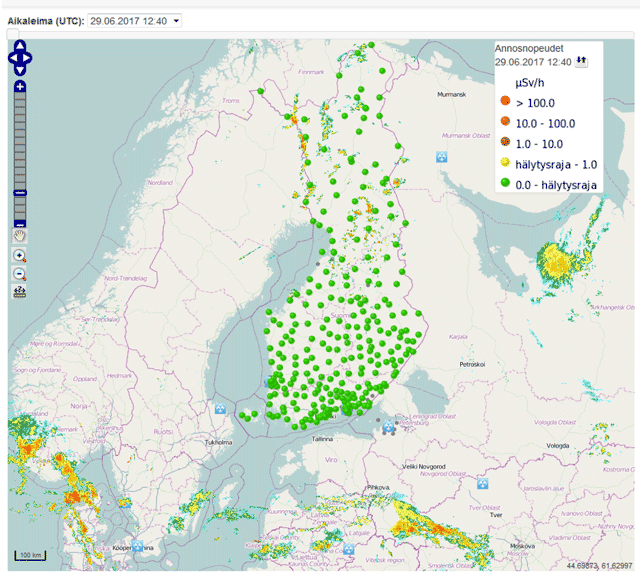
Figure 3
BALTRAD Web Map Services (baltrad-wms) instance displaying weather-radar reflectivity composite data together with the gamma dose-rate monitoring network operated in Finland for nuclear radiation safety.
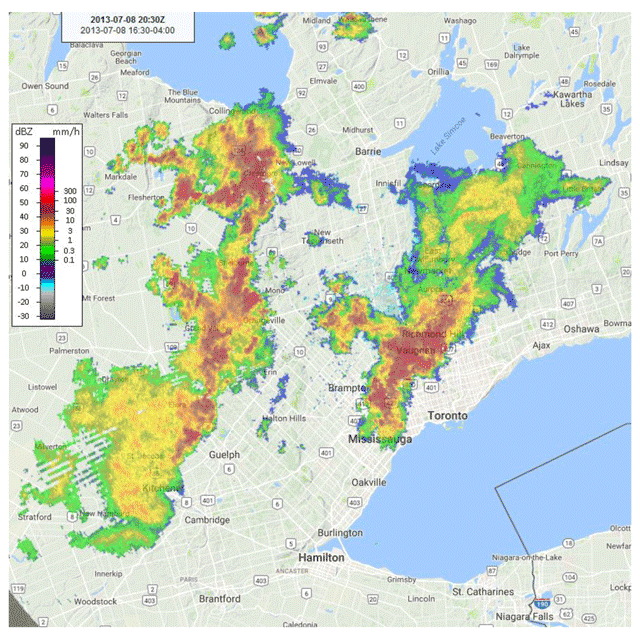
Figure 4
Reflectivity data from the polarimetric King City weather radar north of Toronto, Canada, have been corrected for attenuation at C band [16] through software interoperability between BALTRAD and Py-ART [8] as implemented on the Open Radar Virtual Machine [15]. Visualization uses the experimental interface from BALTRAD to Google Maps. This event on July 8, 2013, gave 138 mm of rain near Toronto Pearson International Airport [17] and flooding that caused an estimated CAD $1 billion in property damage.