
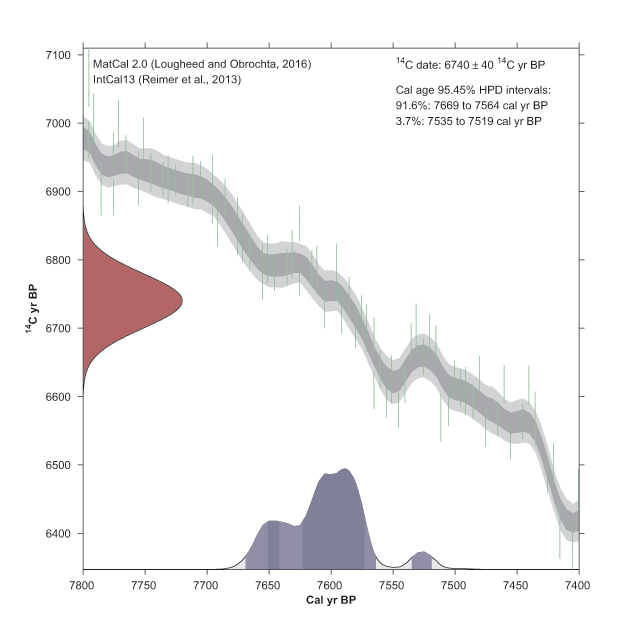
Figure 1
An example of a 14C calibration output plot from MatCal. The red shaded area indicates the 14C age normal distribution. The darker and lighter blue shading respectively indicates the 1 sigma and 2 sigma credible intervals of the calibrated age PDF. The darker and lighter grey shaded areas indicate the calibration curve 1 sigma and 2 sigma confidence intervals, respectively. The green error bars (only shown in the case of IntCal13) indicate the raw 14C data used to construct the calibration curve.
Table 1
14C age calibration in MatCal 2.0, Calib 7.0.0 and OxCal 4.2 and using IntCal13. Calibration results shown are the 1σ calibrated age ranges in Cal yr BP.
| 14C age | MatCal 2.0 | Calib 7.0.0 | OxCal 4.2 |
|---|---|---|---|
| 500 ± 30 | 536 – 514 | 536 – 514 | 537 – 513 |
| 10000 ± 60 | 11610 – 11520 11507 – 11326 | 11610 – 11519 11508 – 11326 | 11610 – 11519 11508 – 11326 |
| 15000 ± 80 | 18346 – 18109 | 18345 – 18109 | 18346 – 18110 |
| 25000 ± 100 | 29177 – 28861 | 29175 – 28859 | 29178 – 28860 |
| 35000 ± 120 | 39758 – 39342 | 39757 – 39339 | 39760 – 39341 |
| 45000 ± 250 | 48801 – 47953 | 48792 – 47944 | 48801 – 47953 |