
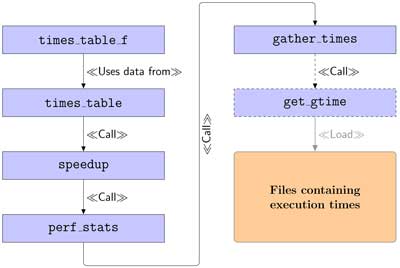
Figure 1
PerfAndPubTools architecture. Blocks in typewriter font represent functions. Dashed blocks represent directly replaceable functions.
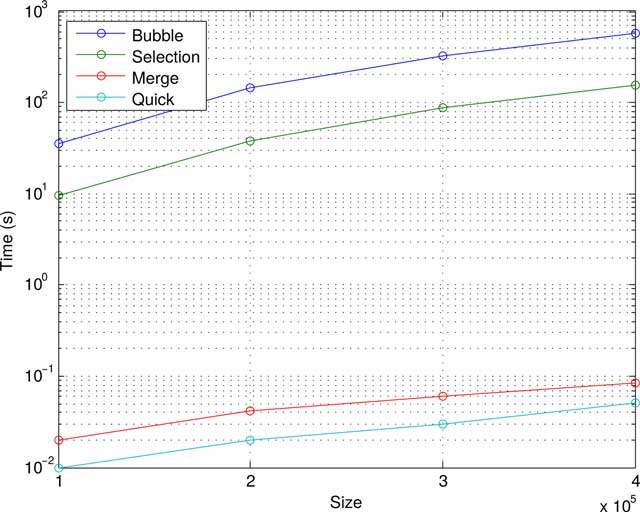
Figure 2
Scalability plot generated by the perfstats function.
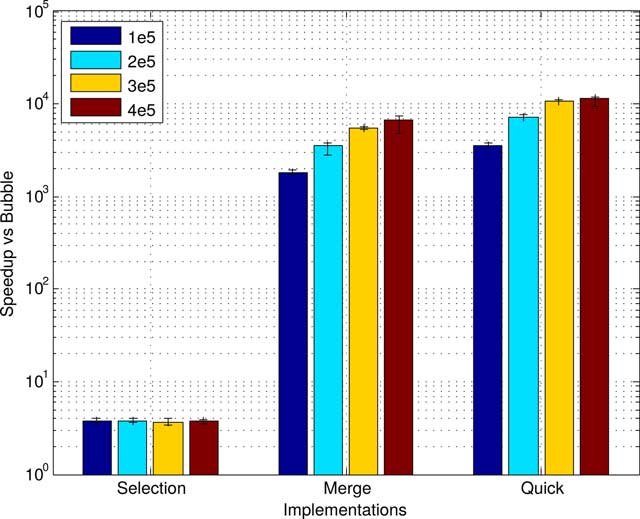
Figure 3
Speedup plot generated by the speedup function.
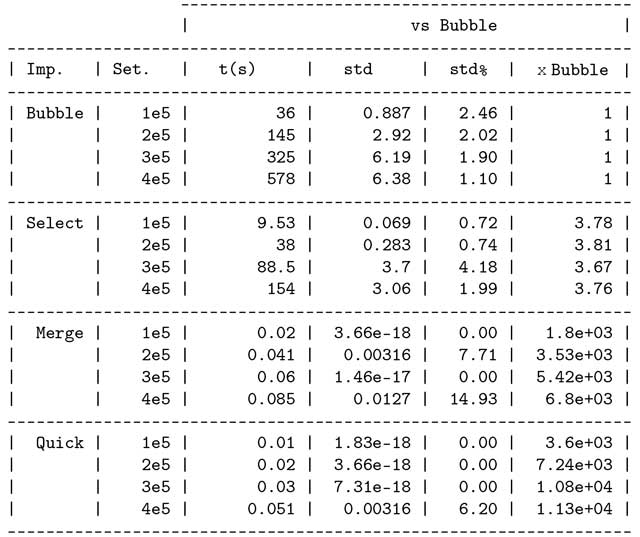
Figure 4
Plain text table generated by times_table_f.

Figure 5
LATEX table generated by times_table_f.