
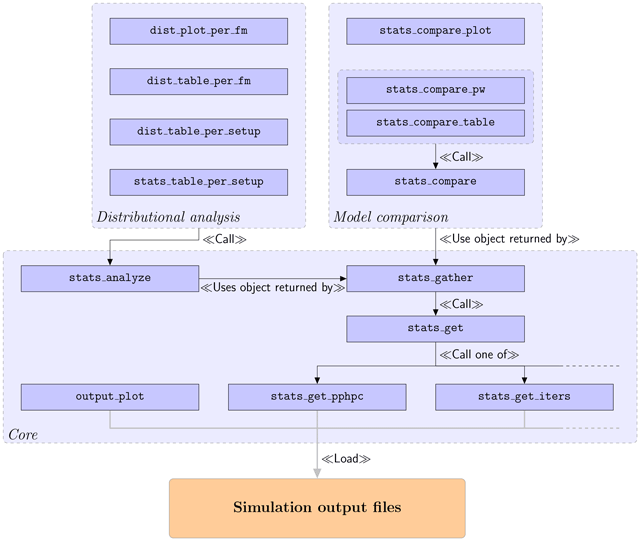
Figure 1
SimOutUtils architecture. Larger blocks with rounded corners and dashed outline constitute function groups, identified in italic font at the lower left corner of the respective block. Within these, functions are represented by smaller blocks with solid outline and sharp corners, with the function name shown in typewriter font. Arrows reflect the relationship between functions and between functions and function groups.
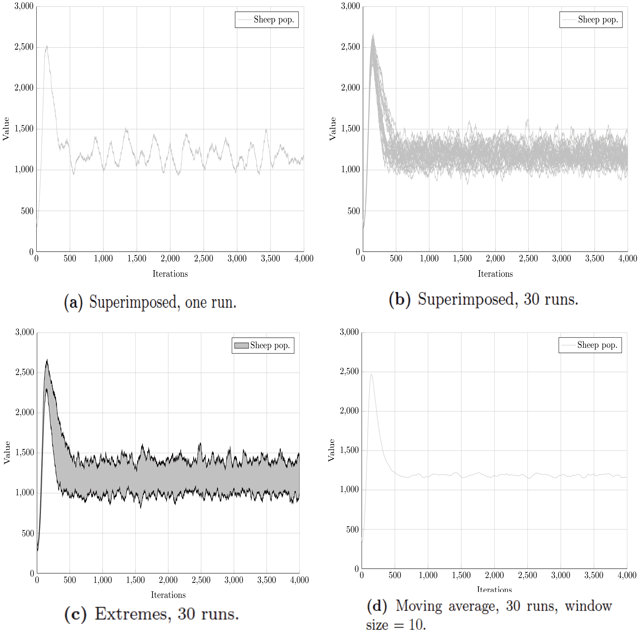
Figure 2
Types of plot provided by the output_plot function. All figures show the sheep population output from the PPHPC model for size 100, parameter set 1 [4].