
Table 1
Options for PyScriptClassifier and PyScriptFilter (* = applicable only to PyScriptClassifier, ** = applicable only to PyScriptFilter). (Note that the names in parentheses are the names of the options as shown in the Explorer GUI, as opposed to the terminal).
| Option | Description |
|---|---|
| -cmd (pythonCommand) | Name of the Python executable |
| -script (pythonFile) | Path to the Python script |
| -args (arguments) | Semicolon-separated list of arguments (variable assignments) to pass to the script when training or testing |
| -binarize (shouldBinarize)* | Should nominal attributes be converted to binary ones? |
| -impute (shouldImpute)* | Should missing values be imputed (with mean imputation)? |
| -standardize (shouldStandardize)* | Should attributes be standardised? (If imputation is set then this is done after it) |
| -stdout (printStdOut) | Print any stdout from Python script? |
| -save (saveScript) | Save the script in the model? (E.g., do not dynamically load the script specified by –script at testing time) |
| -ignore–class (ignoreClass)** | Ignore class attribute? (See Table 2 for more information.) |

Figure 1
The graphical user interface for PyScriptClassifier.
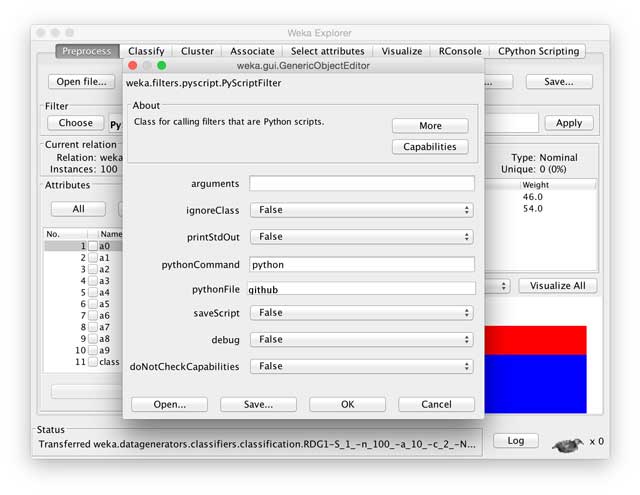
Figure 2
The graphical user interface for PyScriptFilter.
Table 2
Data and meta-data variables passed into args (* = only applicable to PyScriptFilter).
| Variable(s) | Description | Type |
|---|---|---|
| X_train, y_train | Data matrix and label vector for training data. If -ignore-class is set or the class attribute is not specified, y_train will not exist and will instead be inside X_train as an extra column | numpy.ndarray (float 64), numpy.ndarray (int 64) |
| X, y* | Data matrix and label vector for data, when PyScriptFilter calls the process method (see Listing 2) | numpy.ndarray (float 64), numpy.ndarray (int 64) |
| X_test | Data matrix for testing data | numpy.ndarray (float 64) |
| relation_name | Relation name of ARFF | str |
| class_type | Type of class attribute (e.g., numeric, nominal) | str |
| num_classes | Number of classes | int |
| attributes | Names of attributes | list |
| class | Name of class attribute | str |
| attr_values | Dictionary mapping nominal/string attributes to their values | dict |
| attr_types | Dictionary mapping attribute names to their types (possible values are either nominal or numeric | dict |
Listing 1
Skeleton of a Python script for PyScriptClassifier.
def train(args): # code for training model def test(args, model): # code for running model on new instances def describe(args, model): # textual representation of model |
Listing 2
Skeleton of a Python script for PyScriptFilter.
def train(args): # code for training filter def process(args, model): # code for processing instances(training or testing) |
Listing 3
Python implementation of ZeroR.
from collections import Counter import numpy as np def train(args): y_train = args[“y_train”].flatten() counter = Counter(y_train) return counter.most_common()[0][0] def describe(args, model): return “Majority class: %i” % model def test(args, model): num_classes = args[“num_classes”] n = args[“X_test”].shape[0] majority_cls = np.eye(num_classes)[model].tolist() return [majority_cls for x in range(0, n)] |
Listing 4
Output from zeror.py script.
Options: –script scripts/zeror.py Majority class: 0 Time taken to build model: 2.54 seconds Time taken to test model on training data: 0.02 seconds === Error on training data === Correctly Classified Instances 50 33.3333 % Incorrectly Classified Instances 100 66.6667 % Kappa statistic 0 Mean absolute error 0.4444 Root mean squared error 0.6667 Relative absolute error 100 % Root relative squared error 141.4214 % Coverage of cases (0.95 level) 33.3333 % Mean rel. region size (0.95 level) 33.3333 % Total Number of Instances 150 === Detailed Accuracy By Class === TP Rate FP Rate Precision Recall F–Measure MCC … 1.000 1.000 0.333 1.000 0.500 0.000 … 0.000 0.000 0.000 0.000 0.000 0.000 … 0.000 0.000 0.000 0.000 0.000 0.000 … Weighted Avg. 0.333 0.333 0.111 0.333 0.167 … === Confusion Matrix === a b c <-- classified as 50 0 0 | a = Iris – setosa 50 0 0 | b = Iris – versicolor 50 0 0 | c = Iris – virginica |
Listing 5
Optimising sum-of-squares loss in Theano.
import theano from theano import tensor as T import numpy as np # assume 5 attributes for this example num_attributes = 5 w = theano.shared( np.zeros((num_attributes, 1)), name =’w’) b = theano.shared(0.0, name =’b’) # let x be a n*p matrix, and y be a n*1 matrix x = T.dmatrix(’x’) y = T.dmatrix(’y’) # prediction is simply xw + b out = T.dot(x, w) + b # loss function is mean squared error loss = T.mean((out - y)**2) # compute gradient of cost w.r.t. w and b g_w = T.grad(cost = loss, wrt = w) g_b = T.grad(cost = loss, wrt = b) alpha = 0.01 updates = [(w, w - alpha * g_w), (b, b - alpha * g_b)] iter_train = theano.function( [x, y], outputs=loss, updates=updates) |
Listing 6
Output from linear-reg.py script.
Options: –script scripts/linear–reg.py… f(x)= age *0.266773099848 + deficit *0.289990210412 + 4.74354333559 Time taken to build model: 8.49 seconds Time taken to test model on training data: 1.18 seconds === Error on training data === Correlation coefficient 0.607 Mean absolute error 0.448 Root mean squared error 0.5659 Relative absolute error 82.3838 % Root relative squared error 79.4711 % Coverage of cases (0.95 level) 0 % Mean rel.region size (0.95 level) 0 % Total Number of Instances 43 |
Listing 7
Standardise filter in Python.
from wekapyscript import \ ArffToArgs, get_header, instance_to_string import numpy as np def train(args): X_train = args[“X_train”] means = [] sds = [] attr_types = args[“attr_types”] attributes = args[“attributes”] for i in range(0, X_train.shape[1]): if attr_types[attributes[i]] == “numeric”: means.append(np.nanmean(X_train[:,i])) sds.append( np.nanstd(X_train[:,i],ddof=1)) else: means.append(None) sds.append(None) return (means, sds) def process(args, model): X = args[“X”] attr_types = args[“attr_types”] attributes = args[“attributes”] means, sds = model for i in range(0, X.shape[1]): if attr_types[attributes[i]] == “numeric”: X[:,i] = (X[:,i] - means[i]) / sds[i] return args |
Listing 8
Output from standardise.py script.
@relation diabetes_numeric—weka.filters.pyscript.PyScriptFilter … @attribute age numeric @attribute deficit numeric @attribute c_peptide numeric @data —0.952771, 0.006856, 4.8 —0.057814, —1.116253, 4.1 0.364805, 1.017655, 5.2 0.389665, 0.048973, 5.5 0.339945, —2.927268, 5 … |